
The process of value creation
3

Financial capital

The financial capital available to maintain and grow our business

Equity invested by shareholders
R33 585 million
Retained earnings
R26 356 million
Net debt
R7 483 million
Cash generated from operations excluding restructuring costs1
R13 481 million
PIVOT Strategy
|
P
|
Partnerships |
|
I
|
Integrated solutions |
|
V
|
Victory in broadband |
|
O
|
Operational efficiency |
|
T
|
Technology innovation |
ESG strategy
|
EC
|
Empowered communities |
|
OE
|
Operational efficiencies |
|
IWP
|
Investing with purpose |
Read more about our activities to preserve and sustain financial capital in the GCEO’s report and the GCFO’s report.
 |
Group revenue growth (3.3% increase to R43 880 million) |
|
EBITDA margin (cost to income) (26.9%) |
|
Headline earnings (102.4% year-on-year growth and 583.2 cents per share) |
|
Net debt to adjusted EBITDA ratio (gearing) (0.6 times) |
|
Return on invested capital2 (11.0%) |
|
Capex to revenue ratio (capex intensity) (13.3%) |
|
Free cash flow from operations (R2 778 million) |
| 1 | Excludes restructuring cost paid of R160 million. and includes proceeds from plan assets of R330 million relating to the Telkom Retirement Fund settlement which was funded by the proceeds from plan assets, accounted for in investing activities while the payment is recorded in cash paid to suppliers and employees within cash generated from operations. For purposes of disclosing the true number, the proceeds from plan assets are included. |
| 2 | Calculation based on the companies tax rate of 27%. Based on the effective tax rate the return on invested capital calculates to 12.0% |
Key
Capital increased

Capital preserved

Capital eroded
Productive capital

Our fixed and mobile network provides services to retail, business and wholesale customers. It includes earth stations to provide satellite services and towers to transmit across radio spectrum and support the delivery of mobile voice and data services. Fibre-optic and remaining copper cables connect fixed-line customers. Data centres provide hosting, disaster recovery services and cloud services to business customers. Cable landing stations offer international communications diversity, improving customer service levels for global access, services and products.

7 909 sites and >180 000 km
Mobile base stations and fibre network footprint
99.92% access,
99.88% transport, and
99.99% core network availability
1 378 930
Homes and businesses passed with fibre
3
Satellite earth stations
4
Cable landing stations
9 221
Fibre to base station connections
184 MHz
Total mobile spectrum portfolio
465
5G small cell sites
12 600 m2
Data centre footprint
and
9.82 MV
IT capacity
4 012 towers (owned and leased)
Productive sites up to 31 January 2025
PIVOT Strategy
|
P
|
Partnerships |
|
I
|
Integrated solutions |
|
V
|
Victory in broadband |
|
O
|
Operational efficiency |
|
T
|
Technology innovation |
ESG strategy
|
EC
|
Empowered communities |
|
DS
|
Digital services |
|
BS
|
Business stewardship |
Read more about our activities in the productive capital and the GCEO’s reports.
|
Fixed network availability – broadband access (99.92%) |
|
Mobile blended ARPU (R78) |
|
Mobile broadband subscribers in Telkom Consumer (19.5% growth and 15 226 291) |
|
Fibre broadband subscribers in Telkom Consumer (1.9% growth and 554 953) |
|
Fibre to the home connectivity rate (50.4%) |
|
Fibre to base station connections (1.0% growth and 9 221) |
|
Mobile broadband traffic (24.1% growth and 1 759 petabytes) |
|
Fixed-broadband data traffic (26.4% growth and 2 915 petabytes) |
|
Enterprise next-generation data access revenue in BCX (R1 770 million) |
Key
Capital increased
Capital preserved
Capital eroded
Intellectual capital

The intangible assets associated with our brands, our legal licences to operate, our collective expertise and processes, and the strategies, policies, procedures, standards and codes that govern how we do business.

The DNA of Telkom’s key brands
– Openserve, Telkom Mobile, BCX and Gyro
The Group values and initiatives
to embed the Our shared values
Innovation projects
to support our drive for operational efficiency, integrated solutions and technical innovation
Future-ready workforce
(refer to the human capital)
IT systems, research and development
Internal policies, procedures and frameworks
(governance framework, ERM framework) and environmental management systems to maintain compliance and internal controls
Leveraging AI
to improve products, services, internal processes and decision-making
PIVOT Strategy
|
P
|
Partnerships |
|
I
|
Integrated solutions |
|
T
|
Technology innovation |
ESG strategy
|
EC
|
Empowered communities |
|
DS
|
Digital services |
|
BS
|
Business Stewardship |
Read more about our activities in the intellectual capital, the GCEO’s report and the Social and Ethics Committee report.
|
Openserve's interaction net promoter score (iNPS) is 72.3 while BCX's NPS is 33 |
|
“Best Mobile Provider in South Africa” in Ask Afrika Orange Index® 2024 |
|
"South Africa's Best Fibre Network Operator" awarded by Analytico |
|
Escalated customer complaints (decreased by 35% to 4 953) |
|
Number of data breaches (0) |
|
Fibre average time to install (2.3 days) |
|
Beyond Connectivity revenue and as a percentage of total mobile revenue (R1 685 million and 6.9%) |
|
Mobile and fibre service revenue (12% increase and R28 725 million) |
|
Use of AI for IT operations (AIOps) revenue growth (6.2%) |
|
Investment in research, development and innovation (R46 million) |
Key
Capital increased
Capital preserved
Capital eroded
Human capital

Our human capital includes current and future skills, competencies, experience, health and wellbeing. It encompasses human capital dynamics like culture, ethics, diversity, and motivation to be productive and innovative.
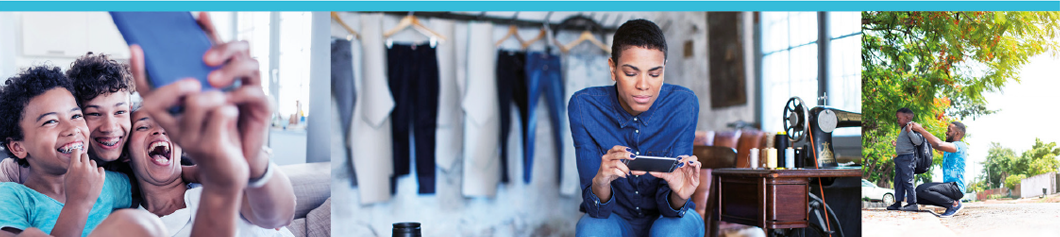
Group culture
9 509
permanent employees
R166m
Training and development spend
>50%
of employees attended training (including digital training and employee development programmes)
810 internships and learnerships
Corporate governance practices, including remuneration and reward practices, and an experienced leadership team
Policies, processes and practices on safety, health, environment and quality
PIVOT Strategy
|
O
|
Operational efficiency |
ESG strategy
|
IWP
|
Investing with purpose |
Read more about our activities in the human capital and Social and Ethics Committee reports.
|
Certified as a Top Employer in South Africa |
|
Employee net promoter score (improved – good place to work: 17, good product and services: 61, work environment: 10) |
|
Salaries and benefits paid to employees (12% increase to R8 813 million) |
|
Succession planning (10% ready-now successors and 58% ready in less than two years) |
|
Key talent retention rate (94%) |
|
Internship and OneTelkom learning programmes retention rate (99%) |
|
Female representation (33%) and women in leadership roles (35.5%) |
|
Black South African representation (72%) |
|
Employee voluntary turnover rate (5%) |
|
Total recordable injury frequency rate (0.57) and lost-time injury
rate (0.46) |
|
Fatalities (0) |
Key
Capital increased
Capital preserved
Capital eroded
Social and relationship capital

Social and relationship capital reflects our contribution to South Africa's society and is anchored in our purpose of seamlessly connecting our customers to a better life.

An ESG strategy
that includes digital services, empowering communities, digital planet and investing with purpose
Stakeholder engagements and relationships
supported by a stakeholder engagement framework and policies and a Stakeholder Management programme
Established structures
to execute Telkom’s corporate responsibility activities, like the Telkom Foundation and FutureMakers programme, with investments of R68 million and R24 million, respectively
Partnerships
with IT application providers and other key partners and suppliers
PIVOT Strategy
|
P
|
Partnerships |
|
T
|
Technology innovation |
ESG strategy
|
IWP
|
Investing with purpose |
|
EC
|
Empowered communities |
|
DS
|
Digital services |
|
DP
|
Digital planet |
Read more about our activities in the ESG strategy, our stakeholders, and the social and relationship capital.

|
Economic value added (R47 764 million) |
|
Number of jobs created (direct and indirect) (73 890) |
|
Procurement opportunities (R859 million) supporting SMMEs (459) |
|
Number of learners and teachers impacted (36 254) |
|
Lives positively impacted through SMME spend (251 203) |
|
Lives impacted through digital literacy (72 278) |
|
Customers connected to broadband and fixed wireless broadband (15.3 million) |
|
South African homes and businesses passed with our FTTx footprint (1 378 930) |
|
Revenue from global IT hardware and software partnerships (R1 527 million) |
Key
Capital increased
Capital preserved
Capital eroded
Natural capital

This includes using natural resources, comprising renewable energy sources, such as solar energy, water, and other non-renewable resources. It includes the environmental impact of electronic and electrical waste (e-waste) and carbon emissions.

Environmental management programmes for water and electricity usage that consider international best practices and relevant laws and regulations
775 103 kL
Water used
581 GWh
Eskom electricity
9.2 GWh
Solar PV electricity used
34.4 GJ
Diesel-generated electricity
3 249 kL
Diesel and petrol used for backup generators during loadshedding
4 717 kL
Fleet diesel used for transport
PIVOT Strategy
|
P
|
Partnerships |
|
O
|
Operational efficiency |
|
T
|
Technology innovation |
ESG strategy
|
OE
|
Operational efficiencies |
|
DS
|
Digital services |
Read more about our activities in the natural capital.
|
Total carbon emissions (3% decrease) |
|
Scope 1 and Scope 2 emissions (10% decrease) |
|
Fossil fuel consumption (59% decrease) |
|
Renewable energy use (149% increase) |
|
Emissions from diesel use (78% decrease) |
|
Migration from R22 refrigerant gases (9% decrease) |
|
Waste to landfill (5% decrease) |
|
E-waste/copper recycled (28% increase) |
|
CDP climate change score (B) |
|
Cumulative IoT devices deployed (95 170) |
Key
Capital increased
Capital preserved
Capital eroded