


 68 / 172

68
03
Performance
Accelerated investment for
future growth
Capex increased 43.3 percent
to R8.6 billion with capex
to revenue of 21.1 percent,
ahead of our guidance but in
line with our strategic focus.
The largest portion of our
capex was deployed to our
primary revenue-generating
areas, which are our fibre
deployment zones and
supporting the acceleration
of our mobile growth.
Our unrelenting investment
drive in fibre and mobile has
now created the required
momentum to support our
strategic growth areas.
FTTP remains our key priority.
We increased the number of
premises passed to over 2.2
million, providing high-speed
broadband connectivity using
next-generation broadband
open-access network.
This is an increase of 44.2 percent from the 1.5 million premises
recorded in the prior year. Mobile investment was accelerated as we
re-farmed our 1 800 MHz spectrum to expand our LTE services to
smart phones. We invested in our mobile network by expanding the
number of integrated base stations by 12.1 percent to 2 986 and
increased capacity in existing sites to cater for the increase in data
traffic growth.
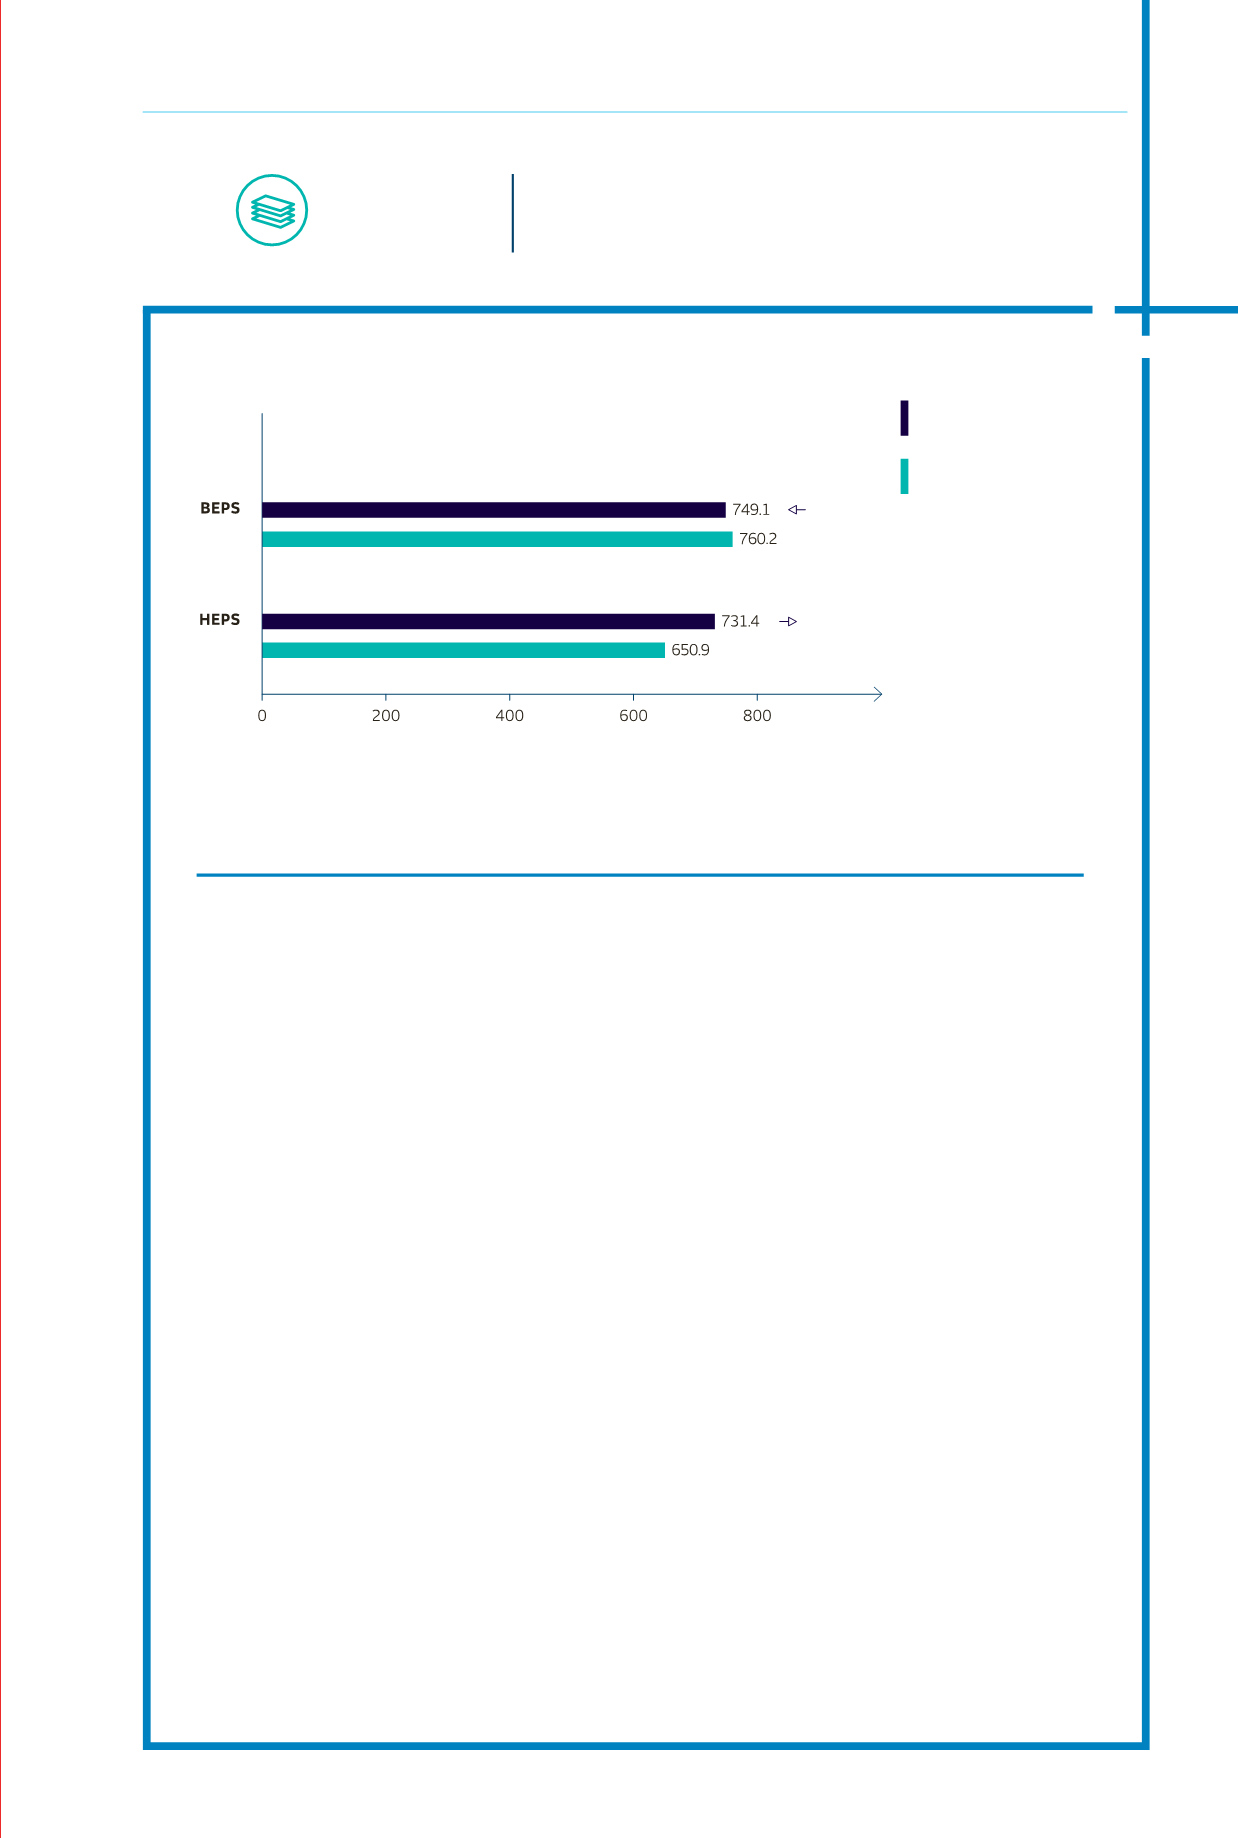
HEPS up on improved operating profits and tax benefits
HEPS grew 12.4 percent to 731.4 cents. Basic earnings per share (BEPS) decreased 1.5 percent to
749.1 cents. The main difference between HEPS and BEPS is the gain on sale of assets.
Group chief financial
officer’s report
– continued
Financial
capital
1.5%
12.4%
Group cash balances at year end declined 40.2 percent to R1.5 billion
compared to the prior year as a result of increased cash outflows
relating to increased dividend payments, VSPs and VERPs payments,
and a significant increase in capital investment.
We have sufficient cash balances and other short-term investments
to fund our annual dividend of 422.0 cents per share in line with our
dividend policy of paying 60 percent of annual headline earnings.
FY2016
FY2017
Cents per share