


 67 / 172

67
Telkom Integrated Report 2017
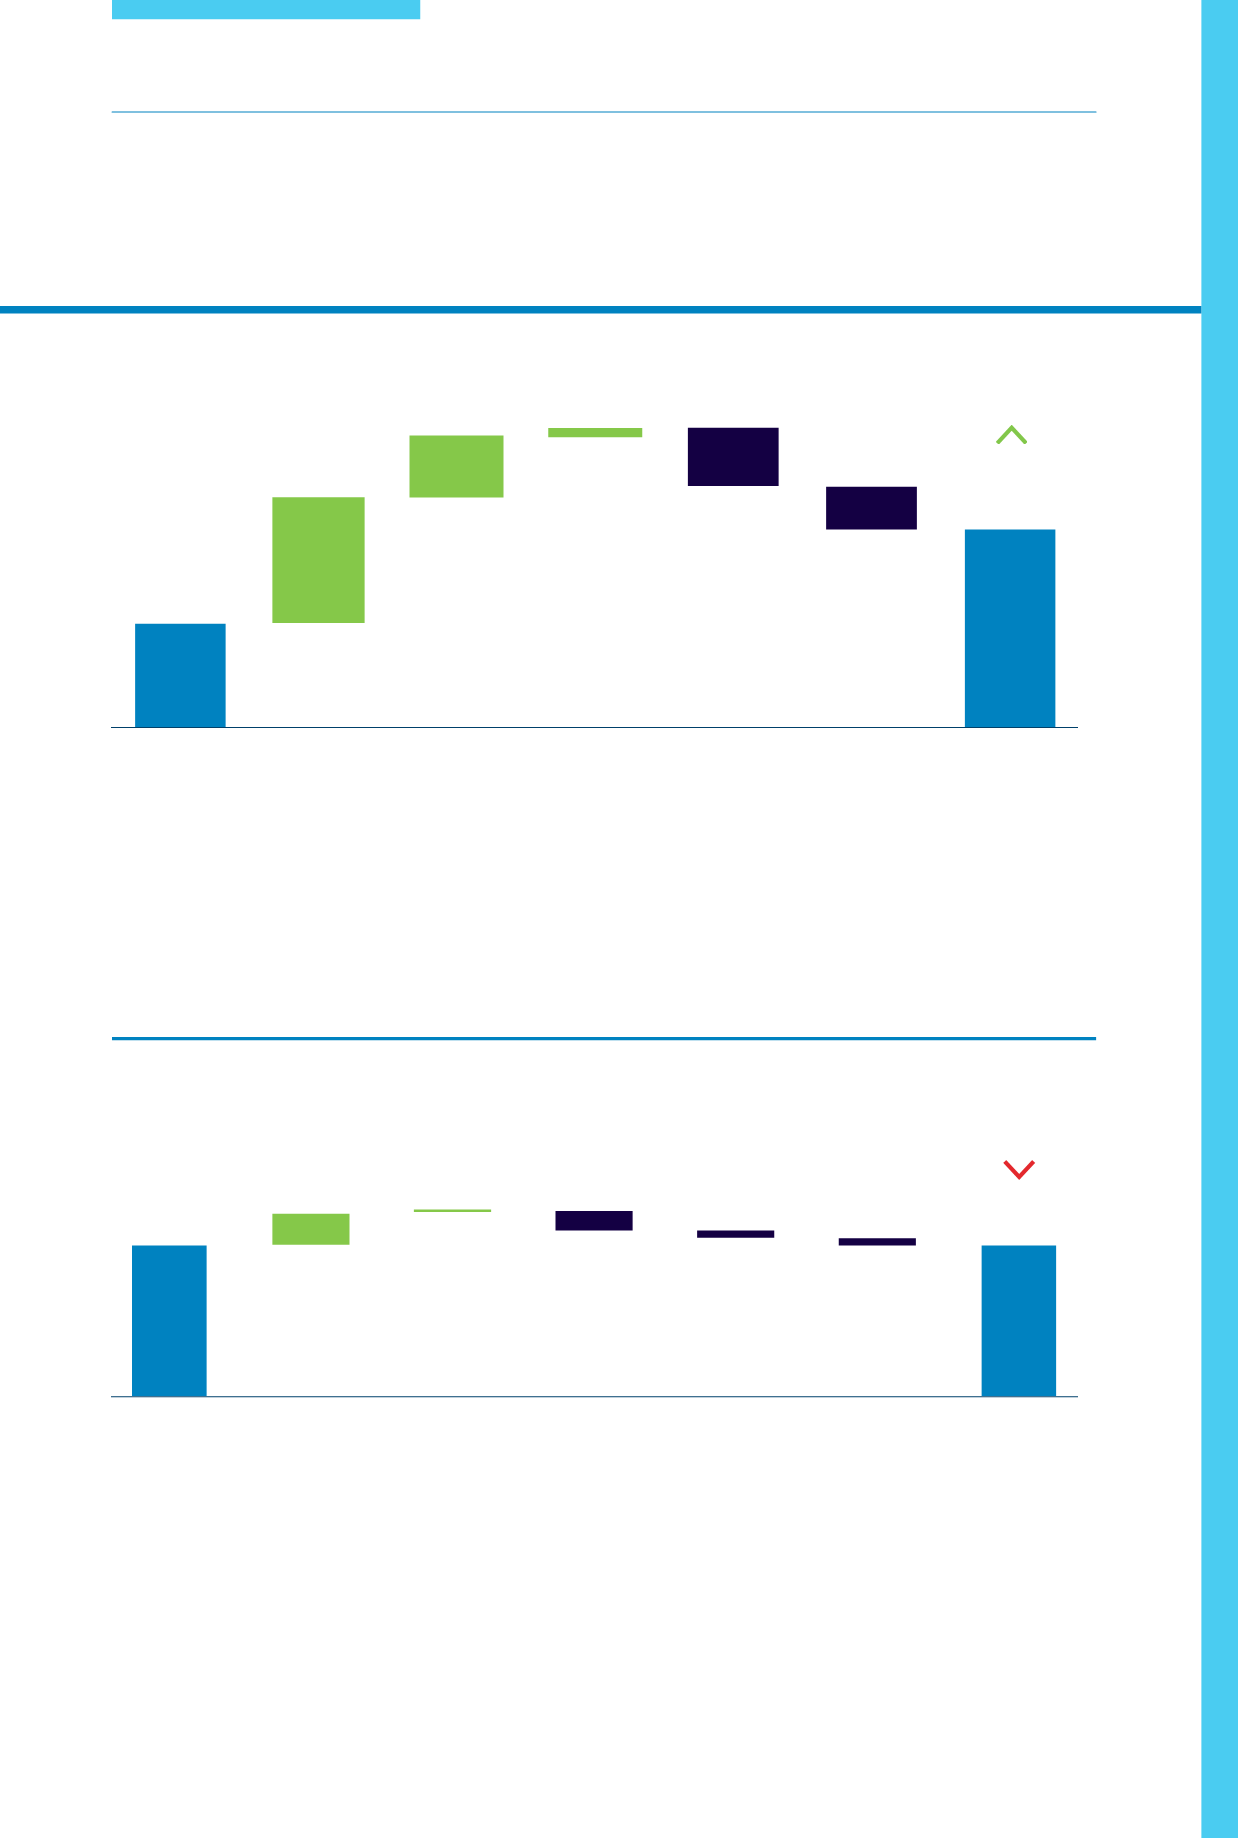
Net revenue movement
R million
29 521
FY2016
Net revenue
IT¹
Mobile
Other
Cost of sales
Voice and
interconnection
FY2017
Net revenue
3 124
1 526
199
(1 449)
(1 067)
31 854
R2 333m
7.9%
Excluding gains on sale of assets, EBITDA increased 4.5 percent
Group EBITDA was stable at R10 941 million with an EBITDA margin of 26.7 percent in a 6 percent inflation
environment. We continued to see efficiencies from our service fees and operating lease expenses as a result
of cost-saving initiatives from our ongoing business transformation. These savings were partially offset by an
increase in selling, general and administration (SG&A) costs relating to outsourcing our shared services and
increased maintenance costs as we accelerate the deployment of our network and improve service levels.
Revenue growth boosted by BCX and Mobile performance
Operating revenue grew 9.8 percent to R40 970 million boosted by the consolidation of BCX for the full year, along
with the solid performance of our Mobile business. Net revenue growth of 7.9 percent was positively impacted by
the reclassification of BCX cost of sales as part of the change of the group accounting policy.
BCX was consolidated for the full year compared to seven months’ revenue in the prior year. The Mobile service
revenue accelerated by 38.4 percent driven by a 47.7 percent increase in active customers as the demand for our
products and mobile services continues to increase.
1.
IT business revenue of R767 million (FY2016: R314 million) previously reported as fixed data is now disclosed as information technology.
1.
The increase in SG&A expenses is largely attributable to the inclusion of the full-year expense of BCX and increased outsourcing costs.
2.
The increase in employee expenses is largely attributable to the inclusion of the full-year expense of BCX which amounted to a year-on-year
increase of R1.9 billion.
FY2016
EBITDA
Net
revenue
Other
SG&A¹
Other
expenses
Employee
expenses²
FY2017
EBITDA
R28m
0.3%
Normalised EBITDA movement
R million
10 969
2 333
151
(1 441)
(547)
(524)
10 941