Our value to society
Telkom adds significant value to South African society. Our business operations
directly contribute value to the economy as a whole, and the extensive reach of our
products and services are indirectly integral to the functioning and development
of society.
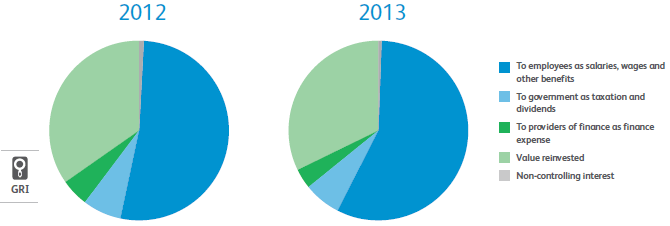
Group value added statement
| |
2013
Rm |
|
2012
Rm |
|
| Value added |
|
|
|
|
| Revenue |
32,501 |
|
33,079 |
|
| Net costs of services and other operating expenses* |
(15,933) |
|
(17,583) |
|
| Investment income |
301 |
|
238 |
|
| Other income |
402 |
|
579 |
|
| |
17,271 |
|
16,313 |
|
| Value distributed |
|
|
|
|
| To employees as salaries, wages and other benefits |
9,861 |
|
8,636 |
|
| To government as taxation and dividends |
1,111 |
|
1,089 |
|
| To providers of finance as finance expense |
660 |
|
765 |
|
| Value reinvested |
5,535 |
|
5,644 |
|
| Net earnings retained |
(19) |
|
53 |
|
| Non-controlling interest |
123 |
|
126 |
|
| |
17,271 |
|
16,313 |
|
| The amounts reflected above have been extracted from the Telkom SA SOC Limited
consolidated annual financial statements for the year end 31 March 2013 and
excludes the R12 billion impairment charge. For a full appreciation of the Financial
Results readers should refer to pages 113 to 239. |
|
|
|
|
| * Included in the figure above is the following distributions: |
|
|
|
|
| Distributed to suppliers |
15,891 |
|
16,435 |
|
| Distributed to corporate social investment through Telkom Foundation |
42 |
|
41 |
|
|


