|
|
Our people
Staff per business unit
Telkom currently operate seven business units, supported by the Corporate Support Centre. The headcount per business unit
is shown below:
| Business unit |
2013 |
|
2012 |
|
| Corporate Centre |
1,785 |
|
1,791 |
|
| Networks and Wholesale |
14,115 |
|
14,265 |
|
| Telkom Business |
837 |
|
821 |
|
| Consumer Services and Retail |
3,378 |
|
3,144 |
|
| Telkom Mobile |
480 |
|
355 |
|
| Telkom Data Centre Operation |
603 |
|
538 |
|
| Telkom International |
11 |
|
25 |
|
| Total |
21,209 |
|
20,939 |
|
Table: Number of permanent staff per business unit.
Strategic workforce and cost planning
The Strategic Workforce and Cost Planning (SWCP )
methodology uses the group strategy as the point
of departure to identify the gap between our current
workforce and future needs. As a result of international
trends affecting traditional fixed line operators (e.g. flat/
declining revenue due to increased competition, migration
of voice to mobile, commoditisation of voice, growth in data and the need for high-speed networks) our workforce
needs are declining. However, we endeavour to minimise
the impact of this on our employees and thus commenced
with a voluntary separation offer to employees towards the
end of the 2013 financial year.
The SWCP process and methodology is repeated annually
as illustrated in the update cycle below.
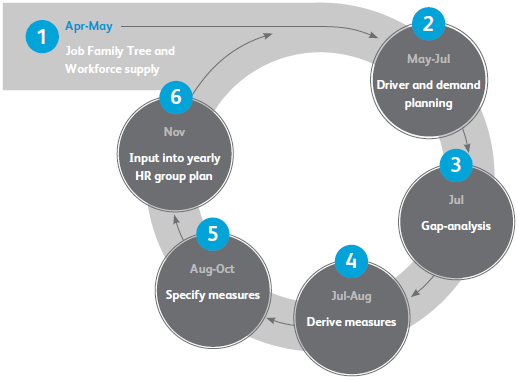
How SWCP informs business and budget decisions
The result of this process is a solid indication of workforce requirements that allows us to plan accordingly. Strategic workforce
planning helps to achieve the transparency needed to facilitate the development of detailed, measurable initiatives that
inform budget requirements. These initiatives are incorporated into the group business plans.
Workforce movements
| Description |
2009 |
|
2010 |
|
2011 |
|
2012 |
|
2013 |
|
| Opening balance |
24,879 |
|
23,520 |
|
23,247 |
|
22,884 |
|
20,939 |
|
| Employee gains |
1,047 |
|
592 |
|
439 |
|
435 |
|
915 |
|
| Appointments |
1,034 |
|
584 |
|
428 |
|
428 |
|
906 |
|
| Re-instatement |
13 |
|
8 |
|
11 |
|
7 |
|
9 |
|
| Employee losses |
2,406 |
|
865 |
|
802 |
|
2,380 |
|
645 |
|
| Voluntary reduction (employee initiated) |
10 |
|
1 |
|
191 |
|
1,873 |
|
(#)55 |
|
| Early retirement |
5 |
|
1 |
|
110 |
|
1,013 |
|
49 |
|
| Severance |
5 |
|
0 |
|
81 |
|
860 |
|
6 |
|
| Natural attrition |
2,396 |
|
863 |
|
611 |
|
507 |
|
590 |
|
| Closing balance |
23,520 |
|
23,247 |
|
22,884 |
|
20,939 |
|
21,209 |
|
| Other employees* |
4,307 |
|
3,557 |
|
2,550 |
|
3,028 |
|
2,938 |
|
| Total headcount |
27,827 |
|
26,804 |
|
25,434 |
|
23,967 |
|
24,147 |
|
Table: Staff trends at Telkom: 2009 – 2013.
| * |
Refers to contract or temporary employees but excludes board members, learnerships and bursary students (Telkom SA employees only). |
| (#) |
Employee retrenchments took place more specifically in the manual exchange environment where it has been phased out. |
Employee trends in subsidiaries
| |
Description |
Trudon |
|
Swiftnet |
|
| |
Opening balance |
520 |
|
107 |
|
| |
Employee gains |
69 |
|
29 |
|
| |
Appointments |
69 |
|
29 |
|
| |
Employee losses |
80 |
|
23 |
|
| |
Employee retrenchments (employee initiated) |
3 |
|
0 |
|
| |
Natural attrition |
77 |
|
23 |
|
| |
Closing balance |
509 |
|
113 |
|
| |
Other employees |
22 |
|
49 |
|
| |
Total headcount |
531 |
|
162 |
|
Workforce demographics
The permanent employee headcount increased from 20,939 to 21,209 in the year under review, while temporary headcount
decreased from 3,028 to 2,938. Females represent 30.9% of the permanent workforce with black representation at 64.9%.
The average age of a Telkom employee has gradually risen from to 43 (female: 40, male: 44) over the last year, and the
average length of service is 18 years (female: 14, male: 20). This data reveals an experienced and mature workforce with a
proven track record.
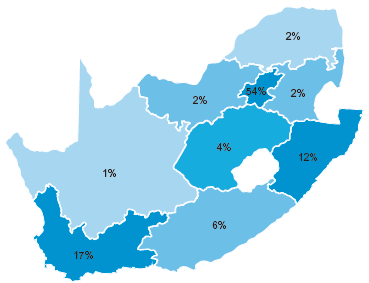
Total workforce by political region
| |
Political Region |
2011 |
|
2013 |
|
2013 |
|
Number of
Trudon
employees |
|
Number of
Swiftnet
employees |
|
| |
Eastern Cape |
1,314 |
|
1,300 |
|
6% |
|
24 |
|
3 |
|
| |
Free State |
761 |
|
782 |
|
4% |
|
13 |
|
0 |
|
| |
Gauteng |
11,239 |
|
11,449 |
|
54% |
|
334 |
|
105 |
|
| |
KwaZulu-Natal |
2,490 |
|
2,516 |
|
12% |
|
54 |
|
2 |
|
| |
Limpopo |
443 |
|
427 |
|
2% |
|
0 |
|
0 |
|
| |
Mpumalanga |
514 |
|
498 |
|
2% |
|
0 |
|
0 |
|
| |
North West |
429 |
|
409 |
|
2% |
|
0 |
|
0 |
|
| |
Northern Cape |
255 |
|
226 |
|
1% |
|
0 |
|
0 |
|
| |
Western Cape |
3,494 |
|
3,602 |
|
17% |
|
84 |
|
3 |
|
| |
Grand total |
20,939 |
|
21,209 |
|
100% |
|
509 |
|
113 |
|
The subsidiaries operate in six regions and a corporate support centre, with approximately half of the total staff being based
in Gauteng.
Total workforce by age group
Age distribution Telkom SA (Permanent employees)
| |
Age range |
31 Mar 07 |
|
31 Mar 08 |
|
31 Mar 09 |
|
31 Mar 10 |
|
31 Mar 11 |
|
31 Mar 12 |
|
31 Mar 13 |
|
| |
20 to 29 |
3,159 |
|
2,578 |
|
2,254 |
|
2,039 |
|
1,822 |
|
1,572 |
|
1,553 |
|
| |
30 to 39 |
10,388 |
|
9,576 |
|
8,602 |
|
7,934 |
|
7,185 |
|
6,228 |
|
5,880 |
|
| |
40 to 49 |
9,507 |
|
9,331 |
|
8,949 |
|
8,944 |
|
8,925 |
|
8,452 |
|
8,386 |
|
| |
50 to 54 |
2,180 |
|
2,535 |
|
2,707 |
|
3,019 |
|
3,321 |
|
3,171 |
|
3,451 |
|
| |
55 to 65 |
630 |
|
859 |
|
1,008 |
|
1,311 |
|
1,631 |
|
1,516 |
|
1,939 |
|
| |
Grand total |
25,864 |
|
24,879 |
|
23,520 |
|
23,247 |
|
22,884 |
|
20,939 |
|
21,209 |
|
| |
Age group |
Number of
Trudon
employees |
|
Number of
Swiftnet
employees |
|
| |
20 – 30 |
99 |
|
30 |
|
| |
30 – 40 |
184 |
|
58 |
|
| |
40 – 50 |
151 |
|
20 |
|
| |
50 – 60 |
61 |
|
5 |
|
| |
60 – 70 |
14 |
|
0 |
|
| |
Grand total |
509 |
|
113 |
|
Age distribution
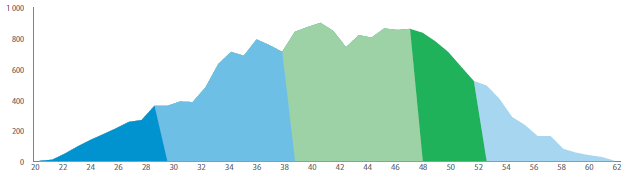
Graph: age distribution as at 31 March 2013
Total number and rate of employee turnover by age, gender and region
Our natural attrition rate increased from 2.3% in 2012 to 2.8% in 2013 (2010: 3.7%, 2011: 2.7). Resignations increased
from 1.6% in 2012 to 1.8% in 2013 (2010: 2.5%, 2011: 1.7%). The recruitment rate increased from 1.9% in 2012 to
4.3% in 2013 largely due to the conversion of temporary workers to permanent workers (2011: 1.9%). The low attrition
rate and limited recruitment needs will continue to constrain our ability to significantly transform the demographic profile
of our workforce. As indicated in the table below, black representation is 64.9% (2011: 62.9%, 2012: 63.9%) while female
representation is 30.9% of the permanent workforce (2011: 29.0%, 2012: 29.8%).
Note: Labour turnover (natural attrition) and benchmarks do not include company initiated losses such as packages.
| |
Age range |
2009 |
|
2010 |
|
2011 |
|
2013 |
|
2013 |
|
| |
20 to 29 |
13.62% |
|
5.03% |
|
4.09% |
|
4.66% |
|
4.80% |
|
| |
30 to 39 |
11.65% |
|
4.25% |
|
3.08% |
|
3.10% |
|
3.50% |
|
| |
40 to 49 |
6.84% |
|
2.78% |
|
2.15% |
|
1.83% |
|
2.24% |
|
| |
50 to 54 |
9.19% |
|
3.49% |
|
2.02% |
|
1.11% |
|
1.72% |
|
| |
55 to 65 |
16.28% |
|
5.00% |
|
2.92% |
|
1.59% |
|
3.30% |
|
| |
Grand total |
9.94% |
|
3.70% |
|
2.65% |
|
2.31% |
|
2.80% |
|
| |
Gender |
2009 |
|
2010 |
|
2011 |
|
2013 |
|
2013 |
|
| |
Female |
8.37% |
|
3.44% |
|
2.39% |
|
1.79% |
|
2.60% |
|
| |
Male |
10.55% |
|
3.81% |
|
2.75% |
|
2.53% |
|
2.89% |
|
| |
Grand Total |
9.94% |
|
3.70% |
|
2.65% |
|
2.31% |
|
2.80% |
|
| |
Race |
2009 |
|
2010 |
|
2011 |
|
2013 |
|
2013 |
|
| |
African |
9.36% |
|
3.78% |
|
2.86% |
|
2.70% |
|
3.02% |
|
| |
Coloured |
8.82% |
|
3.61% |
|
2.38% |
|
1.98% |
|
2.70% |
|
| |
Indian |
9.58% |
|
3.49% |
|
2.30% |
|
2.27% |
|
2.95% |
|
| |
White |
10.96% |
|
3.71% |
|
2.62% |
|
2.00% |
|
2.54% |
|
| |
Foreigner |
43.48% |
|
2.90% |
|
0.00% |
|
3.51% |
|
3.74% |
|
| |
Total |
9.94% |
|
3.70% |
|
2.65% |
|
2.31% |
|
2.80% |
|
Recruitment rate
| |
Age range |
2009 |
|
2010 |
|
2011 |
|
2013 |
|
2013 |
|
| |
20 to 29 |
26.61% |
|
16.72% |
|
11.97% |
|
13.61% |
|
25.34% |
|
| |
30 to 39 |
3.12% |
|
1.90% |
|
1.84% |
|
2.22% |
|
6.11% |
|
| |
40 to 49 |
1.04% |
|
0.72% |
|
0.58% |
|
0.51% |
|
1.37% |
|
| |
50 to 54 |
0.34% |
|
0.14% |
|
0.16% |
|
0.09% |
|
0.54% |
|
| |
55 to 65 |
0.32% |
|
0.00% |
|
0.07% |
|
0.06% |
|
0.41% |
|
| |
Total |
4.27% |
|
2.50% |
|
1.86% |
|
1.95% |
|
4.30% |
|
| |
Race |
2009 |
|
2010 |
|
2011 |
|
2013 |
|
2013 |
|
| |
African |
7.99% |
|
4.12% |
|
2.50% |
|
3.05% |
|
6.40% |
|
| |
Coloured |
2.74% |
|
1.24% |
|
1.24% |
|
1.51% |
|
5.01% |
|
| |
Indian |
2.76% |
|
2.71% |
|
3.04% |
|
1.78% |
|
4.06% |
|
| |
White |
1.38% |
|
1.14% |
|
1.11% |
|
0.92% |
|
1.56% |
|
| |
Foreigner |
26.09% |
|
11.59% |
|
1.65% |
|
1.75% |
|
5.61% |
|
| |
Total |
4.27% |
|
2.50% |
|
1.86% |
|
1.95% |
|
4.30% |
|
| |
Gender |
2009 |
|
2010 |
|
2011 |
|
2013 |
|
2013 |
|
| |
Female |
5.82% |
|
3.65% |
|
2.42% |
|
3.12% |
|
7.75% |
|
| |
Male |
3.68% |
|
2.04% |
|
1.63% |
|
1.47% |
|
2.80% |
|
| |
Grand Total |
4.27% |
|
2.50% |
|
1.86% |
|
1.95% |
|
4.30% |
|
Culture revitalisation
Culture revitalisation across the Group was identified as a
priority in our transformation process. The Barrett Culture
Tools and transformation process are being used to
advance the Group to a value-based performance culture.
Following the 2009 Culture Values Assessment (CVA),
five core values – Continuous performance improvement,
Honesty, Accountability, Respect and Teamwork (CHART) –
were identified.
Employees then identified five desired behaviours
associated with each of the core values. Interventions to
entrench these new values and the associated behaviours
were then put into place through the use of an online
awareness tool, workshops, discussion sessions, and cultural
fit assessments.
Entropy
Entropy is the identification of non-productive or limiting
aspects of Telkom’s organisational culture. It is encouraging
that the level of entropy decreased by 5% to 25% in the
year under review. An entropy level of 10% is regarded as
healthy.
Companies with highly engaged employees usually have
low levels of cultural entropy that, in turn, results in:
| • |
Improved financial performance; |
| • |
High levels of customer satisfaction; and |
| • |
Improved overall company performance. |
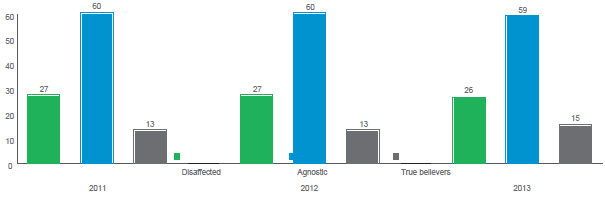
Diagram: entropy levels for the Group.
Diversity and transformation
We were able to positively influence the Group’s workforce demographics during the financial year.
Status of workforce demographics at 31 March 2013 – Telkom SA
| |
Grades |
Black |
White |
Foreign nationals |
Grand
Total |
|
Black |
|
Female |
|
| |
|
Male |
|
Female |
|
Male |
|
Female |
|
Male |
|
Female |
|
|
Total |
|
Total |
|
| |
Top management |
3 |
|
2 |
|
2 |
|
0 |
|
1 |
|
0 |
|
8 |
|
5 |
|
2 |
|
| 38% |
|
25% |
|
25% |
|
0% |
|
13% |
|
0% |
|
|
|
63% |
|
25% |
|
| |
Senior management |
51 |
|
26 |
|
56 |
|
13 |
|
0 |
|
0 |
|
146 |
|
77 |
|
39 |
|
| 35% |
|
18% |
|
38% |
|
9% |
|
0% |
|
0% |
|
|
|
53% |
|
27% |
|
| |
Middle management |
858 |
|
347 |
|
968 |
|
294 |
|
20 |
|
6 |
|
2,493 |
|
1,205 |
|
647 |
|
| 34% |
|
14% |
|
39% |
|
12% |
|
1% |
|
0% |
|
|
|
48% |
|
26% |
|
| |
Junior management |
8,066 |
|
3,679 |
|
4,228 |
|
1,528 |
|
24 |
|
2 |
|
17,527 |
|
11,745 |
|
5,209 |
|
| 46% |
|
21% |
|
24% |
|
9% |
|
0% |
|
0% |
|
|
|
67% |
|
30% |
|
| |
Operational |
302 |
|
395 |
|
71 |
|
236 |
|
0 |
|
1 |
|
1,005 |
|
697 |
|
632 |
|
| 30% |
|
39% |
|
7% |
|
23% |
|
0% |
|
0% |
|
|
|
69% |
|
63% |
|
| |
Support |
11 |
|
16 |
|
1 |
|
1 |
|
1 |
|
0 |
|
30 |
|
27 |
|
17 |
|
| 37% |
|
53% |
|
3% |
|
3% |
|
3% |
|
0% |
|
|
|
90% |
|
57% |
|
| |
Total |
9,291 |
|
4,465 |
|
5,326 |
|
2, 072 |
|
46 |
|
9 |
|
21,209 |
|
13,756 |
|
6,546 |
|
| 44% |
|
21% |
|
25% |
|
10% |
|
0% |
|
0% |
|
|
|
65% |
|
31% |
|
Employment equity statistics
Female distribution over time (numbers)
| |
Gender |
31 Mar 07 |
|
31 Mar 08 |
|
31 Mar 09 |
|
31 Mar 10 |
|
31 Mar 11 |
|
31 Mar 12 |
|
31 Mar 13 |
|
| |
Female |
6,837 |
|
6,825 |
|
6,656 |
|
6,670 |
|
6,641 |
|
6,236 |
|
6,546 |
|
| |
Male |
19,027 |
|
18,054 |
|
16,864 |
|
16,577 |
|
16,243 |
|
14,703 |
|
14,663 |
|
| |
Grand total |
25,864 |
|
24,879 |
|
23,520 |
|
23,247 |
|
22,884 |
|
20,939 |
|
21,209 |
|
Female distribution over time (%)
| |
Gender |
31 Mar 07 |
|
31 Mar 08 |
|
31 Mar 09 |
|
31 Mar 10 |
|
31 Mar 11 |
|
31 Mar 12 |
|
31 Mar 13 |
|
| |
Female |
26.43% |
|
27.43% |
|
28.30% |
|
28.69% |
|
29.02% |
|
29.78% |
|
30.86% |
|
| |
Male |
73.57% |
|
72.57% |
|
71.70% |
|
71.31% |
|
70.98% |
|
70.22% |
|
69.14% |
|
| |
Grand total |
100.00% |
|
100.00% |
|
100.00% |
|
100.00% |
|
100.00% |
|
100.00% |
|
100.00% |
|
Race distribution over time (numbers)
| |
Race |
31 Mar 07 |
|
31 Mar 08 |
|
31 Mar 09 |
|
31 Mar 10 |
|
31 Mar 11 |
|
31 Mar 12 |
|
31 Mar 13 |
|
| |
African |
9,587 |
|
9,497 |
|
9,375 |
|
9,410 |
|
9,357 |
|
8,771 |
|
9,062 |
|
| |
Coloured |
3,577 |
|
3,456 |
|
3,253 |
|
3,178 |
|
3,136 |
|
2,821 |
|
2,886 |
|
| |
Indian |
2,152 |
|
2,059 |
|
1,927 |
|
1,912 |
|
1,908 |
|
1,791 |
|
1,808 |
|
| |
White |
10,539 |
|
9,854 |
|
8,955 |
|
8,688 |
|
8,421 |
|
7,504 |
|
7,398 |
|
| |
Foreigner |
9 |
|
13 |
|
10 |
|
59 |
|
62 |
|
52 |
|
55 |
|
| |
Grand total |
25,864 |
|
24,879 |
|
23,520 |
|
23,247 |
|
22,884 |
|
20,939 |
|
21,209 |
|
Race distribution over time (%)
| |
Race |
31 Mar 07 |
|
31 Mar 08 |
|
31 Mar 09 |
|
31 Mar 10 |
|
31 Mar 11 |
|
31 Mar 12 |
|
31 Mar 13 |
|
| |
African |
37.07% |
|
38.17% |
|
39.86% |
|
40.48% |
|
40.89% |
|
41.89% |
|
42.73% |
|
| |
Coloured |
13.83% |
|
13.89% |
|
13.83% |
|
13.67% |
|
13.70% |
|
13.47% |
|
13.61% |
|
| |
Indian |
8.32% |
|
8.28% |
|
8.19% |
|
8.22% |
|
8.34% |
|
8.55% |
|
8.52% |
|
| |
White |
40.75% |
|
39.61% |
|
38.07% |
|
37.37% |
|
36.80% |
|
35.84% |
|
34.88% |
|
| |
Foreigner |
0.03% |
|
0.05% |
|
0.04% |
|
0.25% |
|
0.27% |
|
0.25% |
|
0.26% |
|
| |
Grand total |
100.00% |
|
100.00% |
|
100.00% |
|
100.00% |
|
100.00% |
|
100.00% |
|
100.00% |
|
| |
Occupational levels |
Male |
Female |
Foreign |
Total |
|
| A |
|
C |
|
I |
|
W |
|
A |
|
C |
|
I |
|
W |
|
Male |
|
Female |
|
| |
Top management |
2 |
|
1 |
|
|
|
2 |
|
2 |
|
|
|
|
|
|
|
1 |
|
|
|
8 |
|
| |
Senior management |
20 |
|
17 |
|
14 |
|
56 |
|
20 |
|
1 |
|
5 |
|
13 |
|
|
|
|
|
146 |
|
| |
Professionally
qualified and
experienced |
441 |
|
192 |
|
225 |
|
968 |
|
233 |
|
44 |
|
70 |
|
294 |
|
20 |
|
6 |
|
2,493 |
|
| |
Skilled technical
and academically
qualified workers,
junior management,
supervisors, foremen |
5,127 |
|
1,820 |
|
1,119 |
|
4,228 |
|
2,689 |
|
652 |
|
338 |
|
1,528 |
|
24 |
|
2 |
|
17,527 |
|
| |
Semi-skilled and
discretionary
decision |
231 |
|
64 |
|
7 |
|
71 |
|
273 |
|
92 |
|
30 |
|
236 |
|
|
|
1 |
|
1,005 |
|
| |
Unskilled and
defined decision
making |
9 |
|
2 |
|
|
|
1 |
|
15 |
|
1 |
|
|
|
1 |
|
1 |
|
|
|
30 |
|
| |
Total |
5,830 |
|
2,096 |
|
1,365 |
|
5,326 |
|
3,232 |
|
790 |
|
443 |
|
2,072 |
|
46 |
|
9 |
|
21,209 |
|
| |
Temporary |
952 |
|
316 |
|
128 |
|
283 |
|
918 |
|
84 |
|
47 |
|
162 |
|
41 |
|
7 |
|
2,938 |
|
| |
TOTAL |
6,782 |
|
2,412 |
|
1,493 |
|
5,609 |
|
4,150 |
|
874 |
|
490 |
|
2,234 |
|
87 |
|
19 |
|
24,147 |
|
Table: gains and losses (Telkom SA )
| |
EE Group
Period |
Appointments
2013
(%)
2013 |
|
Losses
2013
(%)
2013 |
|
Promotions
2013
(%)
2013 |
|
| |
Black |
86.97 |
|
63.65 |
|
76.54 |
|
| |
Female |
55.02 |
|
28.99 |
|
41.34 |
|
Table: employee gains and losses (Trudon)
| |
EE Group
|
Appointments
2013
(%) |
|
Losses
2013
(%) |
|
Promotions
2013
(%) |
|
| |
Black |
27 |
|
30 |
|
4 |
|
| |
Female |
9 |
|
15 |
|
4 |
|
Performance management
All employees undergo regular performance assessments.
This is a process that involves regular feedback and review
sessions, which provide performance and development
plans.
A short-term incentive plan to reward the achievement of
group and business unit performance targets has been in
place for a number of years. I n addition, we embarked on
a process to develop a differentiated reward model, which
is intended to link remuneration to market related salaries
and also differentiate pay based on performance.
For more information refer to the remuneration report
commencing on page 134 of this report.
Talent, training AND retention management
During the financial year, R 255 million (2012: R 245 million)
was invested in training.
We recently completed the first phase of the installation
and commissioning of a new training network. This
dedicated training network is a protected simulated
learning environment that poses very limited security risks
to the production network. This network will enable high-quality
training at a significantly lower cost than would be
possible through the use of external vendors.
| |
Levels |
Permanent
employees
(31 March 2013) |
|
Facilitator led
training days |
|
Average
training days |
|
| |
Top management |
8 |
|
1 |
|
0.1 |
|
| |
Senior management |
146 |
|
35 |
|
0.2 |
|
| |
Middle management |
2,493 |
|
7,234 |
|
3.0 |
|
| |
Junior management |
17,527 |
|
21,170 |
|
1.2 |
|
| |
Operational |
1,005 |
|
64,302 |
|
63.8 |
|
| |
Support |
30 |
|
9 |
|
0.3 |
|
| |
Total |
21,209 |
|
92,751 |
|
4.4 |
|
| |
Training days per employment category |
|
|
Trudon |
|
Swiftnet |
|
| |
Management |
|
|
3.56 |
|
4.20 |
|
| |
Specialists |
|
|
8.48 |
|
0.63 |
|
| |
Operational |
|
|
3.32 |
|
1.69 |
|
Table: comparison of training days (Telkom SA only)
Executive leadership development
The development of a sustainable leadership pipeline
is critical to Telkom’s continuity from a human capital
perspective. This has become increasingly pertinent to the
organisation following the resignations of senior leaders
during the 2013 financial year.
A revised succession planning process was implemented
in April 2012. A phased implementation approach was
followed, commencing with succession planning for the
GCEO and Exco roles. Further to this, we have identified
frontline leadership and critical skills positions to ensure
that successors are identified and developed for those
specific areas of the business.
People development
Below are the key people development initiatives in support of the Group strategy. These initiatives also support the mitigation
of some of the key human capital risks.
| Developing leaders |
|
| • |
Deliver culture workshops in support of culture team |
| • |
Deliver supervisory and management development modules in alignment with talent
management strategy |
|
| a. |
ICT skills transformation |
| b. |
(NGNEC Skills/Telkom Mobile/8•ta) |
|
|
| • |
Conduct ongoing ICT training to support BU strategies |
| • |
Re-skilling employees in line with NGNEC project requirements |
| • |
Enable skills readiness for new product launches |
| • |
Leveraged our CFL partnerships to build ICT business acumen |
| • |
Implement learnerships/internships to create pre-employment pipelines and mitigate
aging workforce and untrainable employee risks |
|
| c. |
Reposition CFL for
ICT Dev Cap |
|
|
| • |
SAQA HE accreditation process in progress for recognition and portability of acquired skills |
| • |
Relevant ICT industry-specific accreditation achieved and continues to build converged
foundation skills at a cost advantage (IC 3/A+/N+/Cisco/etc) |
| • |
NGNEC training network design completed, installation in Olies and Milnerton
completed, other centres on order |
| • |
TLMS installed and eLearning modules to increase access and speed |
|
| d. |
Performance management skills for promoters |
|
|
| • |
Workshop on having difficult conversations for promoters |
| • |
Additional relevant local and global multimedia/eLearning modules on performance
management value chain |
| • |
Evaluation for application of learning and feedback to relevant stakeholders |
|
Impact of the NGNEC rollout
To ensure staff are prepared for the migration to an IP network, we commenced training of field staff in NGN skills
to facilitate a smooth transition from legacy technology in
which they were trained and to which they are accustomed.
Since February 2012, 1,267 candidates were trained,
amounting to 6,335 training days. Training is planned
in a just-in-time manner to occur alongside the planned
network rollout over the next three years.
Programmes for skills management and
lifelong learning
Centre of Excellence programme
This is a collaborative programme between Telkom,
academia, the telecommunications industry and
government to promote research in communication
technology and associated sciences. Sixteen Centres of
Excellence have been established across the country,
making it the largest co-ordinated research effort in ICT in South Africa. Telkom participates in this collaborative
programme by granting full-time bursars the opportunity to
continue their studies and research via the Telkom Centre of
Excellence programme. At present there are 34 individuals
conducting research at the various Centres of Excellence.
In addition, Telkom provides sponsorship to three universities
(University of KwaZulu-Natal, North West University and
the University of Limpopo). This commitment assists
previously disadvantaged students who fail to meet the
university entrance requirements in gaining eligibility to
study engineering via the bridging programme.
Graduate development schemes
It is the policy of Telkom to promote and invest in the
development of skills and knowledge that will enable
employees, their immediate dependants and external
applicants to meaningfully participate in the mainstream
of Telkom’s business and in the South African economy.
Over the past financial year Telkom has dedicated itself
to secure young talent resources and build an ICT skills
pipeline in line with the national agenda for job creation
and employment. There are currently 145 active fulltime
bursary students who should complete their studies
and be ready for placement (dependent on academic
performance) as follows:
2013 : 90
2014 : 45
2015 : 7
2016 : 3
During the 2013 financial year, 58 full-time bursary
students successfully completed their studies.
Change management
Telkom carried out various change management
initiatives over the past year at the individual, group
and organisational level to ensure business projects and
initiatives are implemented successfully. Examples are
the implementation of shared services and customer
experience projects as well as other initiatives prompted
by technological, structural and system changes. These change initiatives help employees to deal with and understand change.
Telkom established a change management philosophy, methodology, process and tools based on the Prosci’s Change Management Model.
Employee relations
The table below records the percentage of employees
covered by collective bargaining agreements.
| |
Type of employees |
Union |
|
Total |
|
% |
|
| |
Bargaining unit |
CWU |
|
7,161 |
|
38.58 |
|
| S.A.C.U. |
|
3,819 |
|
20.57 |
|
| Solidarity |
|
2,880 |
|
15.52 |
|
| No union |
|
4,702 |
|
25.33 |
|
| |
Bargaining unit total |
|
|
18,562 |
|
100.00 |
|
| |
Management |
CWU |
|
201 |
|
7.59 |
|
| S.A.C.U. |
|
275 |
|
10.39 |
|
| Solidarity |
|
194 |
|
7.33 |
|
| No union |
|
1,977 |
|
74.69 |
|
| |
Management total |
|
|
2,647 |
|
100.00 |
|
| |
Grand total |
|
|
21,209 |
|
|
|
Table: union membership as at 31 March 2013
Consultative framework
Organised labour is engaged based on the following consultative framework:
| |
Strategic Consultative (Restructuring) Forum |
| |
| • |
Serves as an engagement platform between the top leadership of both the company and Organised Labour for
sharing information on the new strategic direction of the company, business model, restructuring, mergers and
acquisitions, divestments and so forth. |
| • |
To promote effective communication and dialogue between management and Organised Labour. |
|
| |
National Company Forum |
| |
| • |
Facilitates the implementation of agreements reached at the Strategic Consultative (Restructuring) Forum. |
| • |
Engages on all matters of Consultation and Negotiation impacting on the business and conditions of service for
employees in the defined Bargaining Unit. |
|
| |
Regional Company Forum |
| |
| • |
Facilitate relationships with Organised Labour on a regional level. |
| • |
Facilitates consultation on operational matters specific to the region and refer matters to the National Company Forum. |
|
| |
Local Communication Forum |
| |
| • |
Deals with workplace issues and sharing of information relevant to the workplace. |
|
| |
National Employment Equity and Skills Development Forum |
| |
| • |
Constituted in terms of the Employment Equity Act. |
| • |
Consultative structure on all matters pertaining to Employment Equity and skills development. |
|
Lost days due to industrial action
In December 2012, 56 man-days were lost as a result of the Cosatu organised e-toll strike. Man-days are counted on an
individual employee basis, meaning that 56 employees went on strike for one day.
|


