
Financial capital
 Our financial capital makes it possible for us to produce products, provide services and
invest in organic and inorganic growth. We obtain our financial capital through financing
such as debt, equity or through revenue generated by our operations or investments.
Our financial capital increases when we make a profit. Traditionally it was the primary
measure of business performance and success (‘the single bottom line’) in terms of
reporting performance to shareholders, investors, regulators and government.
| Our approach | FY2015 results | Outlook | |||||||
| Solid financial structure | |||||||||
| Grow EBITDA margin to between 26 to 27% in FY2015 | We achieved an EBITDA margin of 26.5% including retrenchment costs | EBITDA guidance between 26 and 27% | |||||||
| Strong free cash flow | R3.9 billion in free cash flow on 31 March 2015 | Expect to be able to maintain strong
cash flows, but in the current economic environment it will be challenging to maintain this level of cash flow |
|||||||
| Reduce debt | Net debt to EBITDA ratio of 0.02 | Together with strong cash flow provides
excellent flexibility to carry out our strategic objectives |
|||||||
| Improve capex efficiency through a disciplined approach to where and how we deploy capital | Capex to revenue of 16.3% | Capex to revenue of 15 to 18% | |||||||
| Make acquisitions that provide scale and capability in IT infrastructure services through strategic technology investments | If BCX acquisition is approved by the Competition Tribunal it will provide IT scale and capability | Hopeful that Competition Tribunal will
approve our acquisition of BCX. We are ready to rapidly integrate our IT capabilities with those of BCX if and when the acquisition is approved |
|||||||
| Capitalise on the investment we have made in our infrastructure | Improved data volumes and traffic volumes increased 32% | Targeting increased data volumes | |||||||
| Operating efficiency | |||||||||
| Competitive cost base and efficiencies | 1.2% decrease in our costs year-on-year |
Our multi-year cost efficiency programme will see us address all our costs Challenge is to contain operating costs |
|||||||
| Supply and value management | |||||||||
| Replace onerous historic contracts with modern, agile and more flexible commercial arrangements | Introduced a new way of doing business which will give us the flexibility to manage our cost base and improve the customer experience Supply chain management outsourced
to Barloworld who are logistics experts We also outsourced our call centre and our billing systems Employees were transferred to these businesses in terms of section 197 of the Labour Relations Act |
Monitor and measure cost effectiveness and ability to improve customer service of outsourced contact centre Continue rolling out our strategic sourcing model to achieve increased efficiencies and improved customer experience The introduction of an electronic tender portal will decrease turnaround times and provide a single electronic platform for management of tender process |
|||||||
Creating value for our stakeholders through sustainable growth
Financial highlights
Revenues have continued to stabilise in a tough operating environment
- EBITDA increased
15.1%– margin of 28.3% - Operating costs decreased
1.2%in nominal terms- Staff efficiency programme
- Benefits of PRML settlement
- Effective marketing spend
- Lower business transformation cost
- Resolved tax matters, resulting in lower effectivetax rate
- Strong cash flows
| FY2015 results |
March Rm |
|||||||||||||
| 2015 | 2014 | % | ||||||||||||
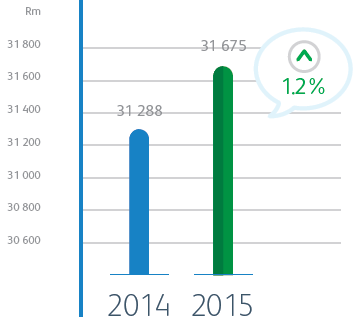
| Operating revenue | 31 675 | 31 288 | 1.2 |
 |
||||||||||
| Net revenue | 25 958 | 25 167 | 3.1 |
|
||||||||||
| Operating expenses | 17 679 | 17 900 | 1.2 |
 |
||||||||||
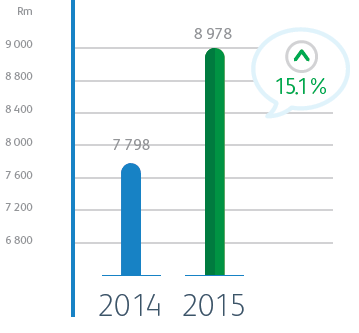
| EBITDA | 8 978 | 7 798 | 15.1 |
|
||||||||||
| Depreciation and impairments | 5 478 | 5 891 | 7.0 |
|
||||||||||
| Capital investments | 5 164 | 6 566 | 21.4 |
|
||||||||||
| Free cash flow | 3 898 | 1 145 |
240.4 |
|
||||||||||
| Normalised headline earnings per share (cps) | 532.5 | 332.9 |
60.0 |
|
||||||||||
ADSL subscribers

Managed data network sites revenue

Traffic volumes in TBytes

It is very encouraging that our efforts at stabilising our business, despite the tough economic environment, are bearing fruit and providing us with a solid base to build on for the future.
On a like-for-like basis, that is excluding items that do not form part of the results from normal business operations, we increased our net revenue by 3.1 percent to R26.0 billion, while our operating revenue increased 1.2 percent to R31.7 billion. Our operating costs, excluding depreciation, were down 1.2 percent to R17.7 billion. Normalised EBITDA rose by 15.1 percent to R9.0 billion.
Operating revenue
as at 31 March 2015
EBITDA
as at 31 March 2015
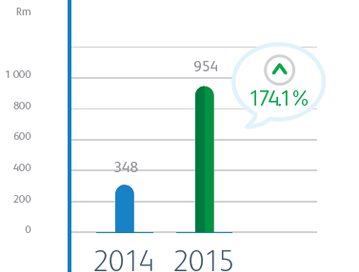
Our Retail Consumer segment performed well with excellent results from our mobile business, which increased its net revenues by 174.1 percent to R954 million. Subscriber revenue growth increased by 46 percent to R717 million, mainly as a result of an approximately 21 percent increase in the number of active mobile subscribers and around 20 percent in the blended average revenue per user (ARPU). We are hopeful that we can continue to maintain this sort of growth in our mobile business and it is encouraging that we are being more successful at monetising our investment in the network.
Fixed-line data revenue increased 1.5 percent to R10.4 billion and mobile data revenue increased 50.6 percent to R988 million. The pressure remains on voice usage, particularly in our Enterprise business. This resulted in an 11.9 percent decrease in fixed-line voice and interconnection revenue to R8.3 billion. A disappointment was the fall-off of 22 percent in leased lines, which accounts for about R400 million.
We also saw a 7.9 percent growth in ADSL subscriptions to just over a million, however, while we are achieving good growth, at the same time we are experiencing significant pressures on pricing.
Mobile net revenue
as at 31 March 2015
ADSL subscribers
at 31 March 2015

Derisking the business: growth in mobile data, stabilisation of voice rentals
-
 Contributions
to group revenue
 33% Fixed-line data
 26% Fixed-line voice
usage and interconnection
 25% Fixed-line
subscriptions
 11% Mobile
 3% Fixed-line
Customer premises
equipment
 2% Other
Contributions to group revenue (%)


Fixed-line voice usage continued to decline
Committed to:
Revenue at risk declined (fixed-line voice usage and interconnection revenue)
Contributes 26% (2014: 30%) of group revenue
Our key focus in terms of capital investment will be on LTE, LTE-A and fibre.
Our costs decreased 1.2 percent, largely because of savings on employee expenses and more effective marketing, which saved us around 11 percent, equating to around R85 million less than we spent last year. There was also a decline in transformation costs and vehicle use. On the other hand, we incurred R319 million in bad debts in the current economic climate and we also had some inventory write-offs.
The 3.7 percent reduction in employee expenses was mainly as a result of a 4.5 percent reduction in our headcount and an almost 47 percent reduction in our contractor headcount. We also saw savings from the settlement of the post-retirement medical aid obligation. These decreases were offset by a 6.2 percent average salary increase for bargaining unit members and an average salary increase of around six percent for management.
Our capital expenditure is 21 percent down year-on-year. We will continue with our measured approach going forward to ensure that we focus on revenue generation, efficiency, and at the same time that we build in the right areas. Our rollout of the next generation network was interrupted in the early part of the year because of a lack of availability of certain equipment; however, in the second half of the year we accelerated our capital investment and in the year ahead we expect to increase it further. Our key focus in terms of capital expenditure will be on LTE, LTE-A and fibre. This is a capital intensive industry and we need to balance the need for new technologies with the required return on our investment.
Our good cash flow and our low net debt to EBITDA ratio provides us with excellent financial flexibility when it comes to any opportunities there may be in the market.
Overall, we have achieved what we promised in terms of stabilising the business so we can grow, although we experienced greater pressure on voice usage than we expected and the fall-off in leased lines was also more severe than expected.
Supply and value management
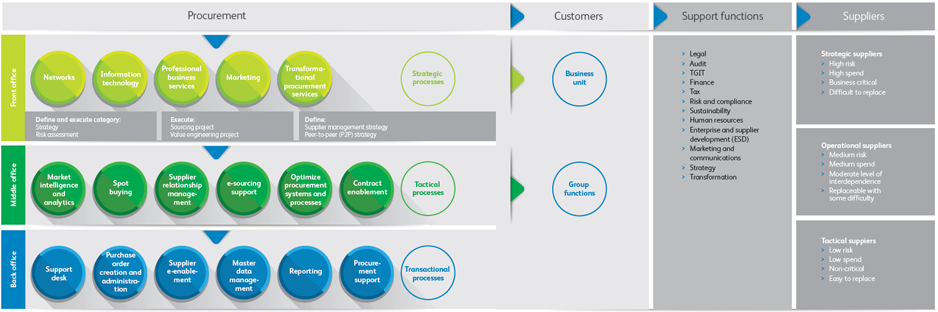
During FY2015 we developed and started implementing a strategic sourcing model as part of our new way of doing business, which allows us to be more agile and flexible with our procurement. This model replaces the tactical approach previously adopted by Telkom.
One of the first applications of this approach was the outsourcing of our contact centre to industry experts who have both the economies of scale and the expertise necessary to reduce our costs and improve our customer experience.
Post year end a further implementation of our strategic sourcing model saw our entire supply chain business being sold to logistics experts, Barloworld, on 1 May 2015. Because of its expertise in this area and the economies of scale it can achieve Barloworld will run our supply chain at a lower per unit cost than Telkom is able to do. This will not only reduce our costs, but will also reduce our environmental impact, and in particular our carbon footprint.
An important element of both these arrangements is the access to expertise they provide that will not only reduce costs but will also help us provide better customer service.
Procurement operating model
Enlarge Procurement operating model graphic

Enterprise development

 Enterprise development (ED) is an important
part of our social commitment to broad-based
black economic empowerment and preferential
procurement. Through our FutureMakers
programme, launched post year end in May 2015,
we are investing R100 million over five years in
enterprise and supplier development. Not only
will this programme support the national drive
to increase access to technology, it will also help
us grow the ICT sector and Telkom’s revenue.
Details of the FutureMakers programme can be
found on page 87 of the Social and Relationship
capital section of this report, as can information
on Telkom’s achievements in terms of ED and
preferential procurement from black-owned
businesses. The potential the FutureMakers
programme has to grow Telkom’s revenue is also
discussed on page 69 of the Productive capital
section of this report.
Outlook
We have stabilised the business, but the operating environment is very difficult at present and we recognise we have a challenging year ahead of us. We will be addressing non-profitable areas going forward and we will continue to focus on cost reduction and revenue generation. We had initiatives planned for the year under review that did not materialise, specifically in terms of our headcount reduction programme which we will have to address in the FY2016 financial year. Because of that we are keeping our EBITDA guidance at between 26 and 27 percent for FY2016.
We expect to increase our capital expenditure, with a focus on LTE and fibre rollout and also on the IT side. We have also made additional capex available so we can close any gaps in the network as well as the product areas. This supports one of the important changes in Telkom: we are listening to our customers and doing our best to give them what they want.
We’re operating in a challenging, fast changing environment, but we believe we are ideally placed to execute from the stable base we have built over the past few years.
