
Telkom SA SOC Limited
Integrated Report 2017
For the year ended 31 March 2017
Performance

Financial capital | Group chief financial officer's report |

Operating revenue up
9.8%
to R40 970 million

Net revenue up
7.9%
to R31 854 million

EBITDA margin of
26.7%*

Headline earnings
per share (HEPS) up
12.4%*
to 731.4 cents
Annual dividend
increased 56.3% to
422.0 cents
per share

Capex up
43.3%
to R8 654 million
| * | Our performance excludes the R2 193 million and a related tax benefit of R517 million relating to voluntary early retirement packages (VERPs) and voluntary severance packages (VSPs) in FY2016, and R66 million and a related tax benefit of R13 million FY2017. |
Key messages
- We delivered solid results in a difficult environment
- Our Mobile business continued to outperform our expectations, with a service revenue increasing of 38.4 percent
- Our fixed date business was slightly down 1.1 percent, however we were encouraged by an increase in next generation and fibre based products, such as metro-ethernet
- We saw good growth in IT revenue. We expect this to continue past the integration of BCX with Enterprise, as we offer end-to-end solutions
- We continued to see the benefits of our ongoing business transformation. Our Mobile business contributed R660 million to the group EBITDA improvement for the first time, after four years of recording losses
- Our group cash balances were negatively impacted by increased cash flows relating to dividend payments, VSP and VERPs and a significant capital investment
- We accelerated capex to revenue increasing to 21.1 percent with specific focus on fibre and mobile as we saw traction in both areas
- We increased our annual dividend by 56.3 percent year-on-year. Our TSR was 38 percent for the year
Revenue growth boosted by BCX and Mobile performance
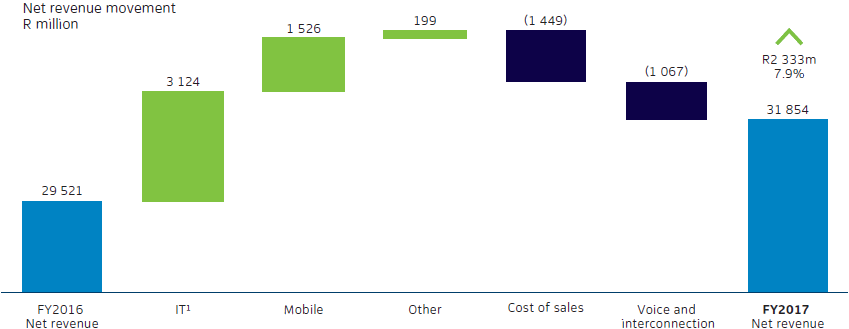
1. IT business revenue of R767 million (FY2016: R314 million) previously reported as fixed data is now disclosed as information technology.
Operating revenue grew 9.8 percent to R40 970 million boosted by the consolidation of BCX for the full year, along with the solid performance of our Mobile business. Net revenue growth of 7.9 percent was positively impacted by the reclassification of BCX cost of sales as part of the change of the group accounting policy.
BCX was consolidated for the full year compared to seven months’ revenue in the prior year. The Mobile service revenue accelerated by 38.4 percent driven by a 47.7 percent increase in active customers as the demand for our products and mobile services continues to increase.
Excluding gains on sale of assets, EBITDA increased 4.5 percent
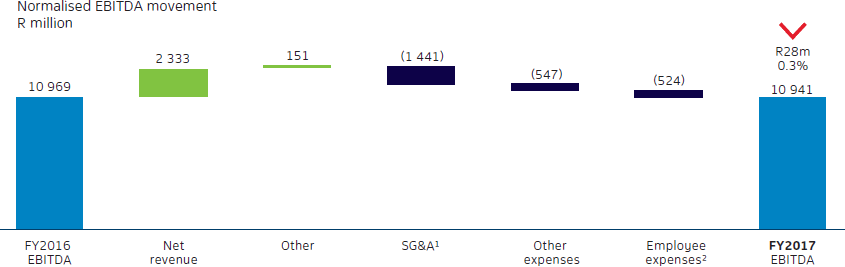
1. The increase in SG&A expenses is largely attributable to the inclusion of the full-year expense of BCX and increased outsourcing costs.
2. The increase in employee expenses is largely attributable to the inclusion of the full-year expense of BCX which amounted to a year-on-year
increase of R1.9 billion.
Group EBITDA was stable at R10 941 million with an EBITDA margin of 26.7 percent in a 6 percent inflation environment. We continued to see efficiencies from our service fees and operating lease expenses as a result of cost-saving initiatives from our ongoing business transformation. These savings were partially offset by an increase in selling, general and administration (SG&A) costs relating to outsourcing our shared services and increased maintenance costs as we accelerate the deployment of our network and improve service levels.
HEPS up on improved operating profits and tax benefits
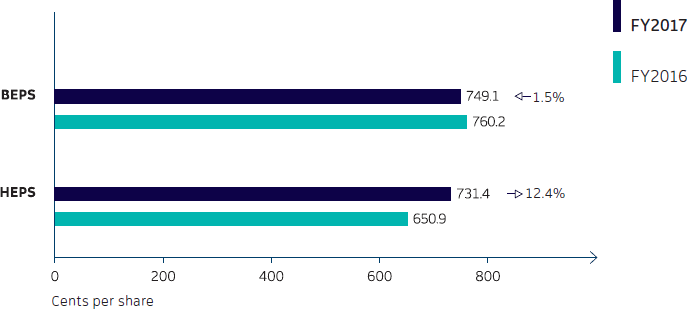
HEPS grew 12.4 percent to 731.4 cents. Basic earnings per share (BEPS) decreased 1.5 percent to
749.1 cents. The main difference between HEPS and BEPS is the gain on sale of assets.
Accelerated investment for future growth
Capex increased 43.3 percent to R8.6 billion with capex to revenue of 21.1 percent, ahead of our guidance but in line with our strategic focus. The largest portion of our capex was deployed to our primary revenue-generating areas, which are our fibre deployment zones and supporting the acceleration of our mobile growth.
Our unrelenting investment drive in fibre and mobile has now created the required momentum to support our strategic growth areas.
FTTP remains our key priority. We increased the number of premises passed to over 2.2 million, providing high-speed broadband connectivity using next-generation broadband open-access network.
This is an increase of 44.2 percent from the 1.5 million premises recorded in the prior year. Mobile investment was accelerated as we re-farmed our 1 800 MHz spectrum to expand our LTE services to smart phones. We invested in our mobile network by expanding the number of integrated base stations by 12.1 percent to 2 986 and increased capacity in existing sites to cater for the increase in data traffic growth.
Group cash balances at year end declined 40.2 percent to R1.5 billion compared to the prior year as a result of increased cash outflows relating to increased dividend payments, VSPs and VERPs payments, and a significant increase in capital investment.
We have sufficient cash balances and other short-term investments to fund our annual dividend of 422.0 cents per share in line with our dividend policy of paying 60 percent of annual headline earnings.
Capex – key focus areas
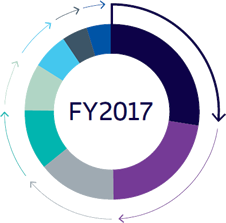
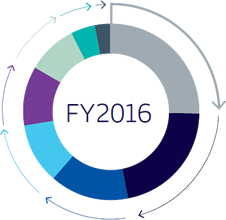
- 27.6%Fibre
- 22.4%Mobile
- 14.5%Service on
demand - 11.1%Core network
- 8.6%OSS/BSS
programme - 6.6%Network
rehabilitation/
sustainment - 4.7%Subsidiaries*
- 4.6%Other
- 25.5%Service on
demand - 21.7%Fibre
- 14.3%Other
- 11.2%Network
rehabilitation/
sustainment - 10.9%Mobile
- 9.0%OSS/BSS
programme - 4.5%Core network
- 2.9%Subsidiaries*
* BCX, Trudon, Swiftnet, Acajou (VS Gaming).
Strong balance sheet to fund future growth
Despite the increase in net debt, including financial assets and liabilities, to R5 020 million from R1 373 million as at 31 March 2016, our capital structure remains strong with a net debt-to-EBITDA ratio of 0.5 times. Our net debt to EBITDA remains below our guidance of one time, providing us with sufficient capacity to invest in future growth.
On 31 March 2017, the group had cash balances, including other financial assets and liabilities, of R1 204 million (31 March 2016: R3 841 million). Our group cash balances decreased mainly due to higher dividends paid and an increase in capital expenditure in line with our strategy. We remain lowly geared with a comfortable debt maturity profile.
Outlook
- Our guidance should be considered in light of the current difficult operating environment and the recent sovereign rating downgrade. Furthermore, we continue with our cost transformation programme, while managing challenges and investing for the future through our operating and capital investments.
- Despite negative GDP growth expectations for South Africa and a continued decline in voice revenue, we expect to grow our operating revenue by mid single digit.
- EBITDA margin of 23 to 25 percent implies contraction in margins as a result of an increase in our operating expenditure investment in new subsidiaries such as Gyro, VS Gaming and supporting of our Mobile business. Our benefit from the gain on sale of assets will reduce from the previous year, as we focus on extracting long-term value from the balance of our property portfolio.
| Guidance | FY2017 | FY2017 |  |
FY2018 | |||||||||
| Guidance | Actual | Guidance | |||||||||||
| Net revenue | Modest growth | 7.9% | |
N/A | |||||||||
|---|---|---|---|---|---|---|---|---|---|---|---|---|---|
| Operating revenue | Mid-single digit | ||||||||||||
| EBITDA margin | 23%-25% | 26.5%* | |
23% to 25% | |||||||||
| Capex to revenue | 15%-18% | 21.1% | |
17% to 20% | |||||||||
| Net debt to EBITDA | ≤ 1 | 0.5 | |
≤ 1 | |||||||||
| Mobile EBITDA breakeven | Achieve | R660 million | |
N/A | |||||||||
| Annual dividend increased 56.3% to 422.0 cents per share | |||||||||||||
| * | Includes VERP and VSP costs. |
- Capex to revenue of 17 to 20 percent. We have accelerated our capex to revenue as we continue to invest for the future. We will apply a success-based and measured approach to capex. Our key focus areas will remain fibre and mobile. Returns for fibre are long-term in nature while returns for mobile are medium-term in nature. It is critical that we invest for the sustainability of our business. We will continue our measured and responsible allocation of capital resources.
- Our target net debt ratio is ≤1 times. We expect to see an increase in our net debt-to-EBITDA ratio as we gear up our balance sheet to fund growth areas of our business. However, we do not expect our capex funding to breach our target for FY2018.
We confirm our dividend policy of 60 percent of headline earnings as we continue to invest for the future and address current competitive challenges.
We will remain disciplined in our cost allocation while focusing on generating free cash flows.
Dividend policy
During the year, the board amended our dividend policy to an annual dividend of 60 percent of headline earnings with an interim dividend of 40 percent of interim headline earnings.
Declaration of dividend
In line with our dividend policy, the board declared a final ordinary dividend 20 of 290.75253 cents per share. This follows an interim dividend of 131.23874 cents per share declared in the interim results, taking the annual dividend in respect of the financial year to 421.99127 cents per share (FY2016: 270 cents per share). The declared dividend is payable on Monday, 3 July 2017 to shareholders recorded in the register of the company at close of business on Friday, 30 June 2017. The dividend will be subject to a local dividend withholding tax rate of 20 percent which will result in a net final dividend of 232.60202 cents per ordinary share to those shareholders not exempt from paying dividend withholding tax. The ordinary dividend will be paid out of cash balances.
The number of ordinary shares in issue at date of this declaration is 526 948 700. Telkom South Africa SOC Ltd’s tax reference number is 9/414/001/710.
For full financial statements refer to www.telkom.co.za/ir
Deon Fredericks
Group chief financial officer