
Telkom SA SOC Limited
Integrated Report 2017
For the year ended 31 March 2017
Transparency and accountability

Remuneration
structure
The remuneration structure is aligned with the group strategy and the agreed risk appetite, which seeks to reward success fairly, responsibly and transparently, while avoiding paying more than is necessary. The objectives of the policy are:
- to promote sustainable value creation through transparent alignment with agreed corporate strategy
- to ensure that proper risk management processes are in place and that remuneration is appropriately aligned with both short and long-term performance
- to ensure that all employees are remunerated competitively relative to industry benchmarks, provided with appropriate incentives to encourage enhanced performance, and rewarded for their individual contributions to the success of the company
- to ensure that remuneration is affordable and reasonable in terms of sustainable value creation for shareholders
We follow a holistic, balanced approach across the following remuneration elements:
| Elements | Type | Participants and composition of pay | Desired outcome | |||||||
| Guaranteed package | Fixed | All employees Guaranteed packages consist of a basic pensionable salary, retirement provision and flexible benefits, which include a non-pensionable allowance and a travel allowance where applicable. |
Influenced by the scope of the role and the knowledge, skills and experience required. Salary levels are positioned at a market median. | |||||||
| Short-term incentives (STIs) | Variable | All employees STIs comprise a cash payment that is payable after finalisation of audited results. The STI plan is designed and aligned with the shareholders’ expectations. |
Delivers rewards on the achievement of annual performance targets. The level of achievement determines the level of payment against each weighted company performance measure. | |||||||
| Long-term incentives (LTIs) | Variable | All employees
|
Motivate long-term sustainable stretch performance and align the interests of management with those of shareholders. |
Guaranteed packages are influenced by the scope of the role and the knowledge, skills and experience required of the position holder. The packages reflect the market median which is determined through external market research that yields market data and appropriate salary ranges for specific positions.
Guaranteed packages
Introduction
| Gauranteed packages | |||
| The guaranteed packages consist of a basic pensionable salary, retirement provision and flexible benefits |
Basic pensionable salary
|
Employees are not entitled to annual guaranteed package increases. Annual increases are subject to industry market conditions, employee performance, internal equity, strategic investments and the company’s overall financial position, financial performance and ability to pay. The packages are reviewed against individual performance, set against a market median, and determined on a total cost-to-company basis.
Employees can structure their packages within the framework of the applicable policies, practices and regulatory requirements. Remuneration adjustments outside the annual remuneration review process may be considered in exceptional circumstances and will be subject to the agreed authorisation.
All positions are evaluated to determine their relative value and contribution in terms of complexity and required outcomes. Positions are evaluated using the company’s job evaluation system, which correlates with the Paterson Grading System as follows:
| Hierarchical level | Level of leadership | Telkom grade | |||||
| Group chief executive officer | Executive committee | MO | |||||
| Chief officers | Executive management | M1 | |||||
| Managing directors/group/managing executives | M2 | ||||||
| Executives | Executive leadership | M3 | |||||
| Senior manager/manager | Frontline leadership | M4/5 | |||||
| Operations manager/supervisor | Frontline leadership | M6 | |||||
| Support staff/technician/specialist | Operational | OP/2/A |
Exco
Guaranteed packages are in line with similar roles in the comparable market according to organisational size, profitability and complexity. They are influenced by the scope of the role and knowledge, skills and experience required of the employee. Guaranteed packages are reviewed against individual performance, and set against market median. For full details on exco refer to page 123. The average guaranteed package increase was 0 percent (FY2016: 6 percent).
Management employees
Guaranteed packages for management levels are reviewed annually as part of the company’s overall remuneration review process and are assessed against individual performance. The average guaranteed package increase was 0 percent (FY2016: 6 percent).
Bargaining unit employees
Telkom follows a balanced approach in granting annual salary increases for bargaining unit employees with due consideration of the Consumer Price Index (CPI), market movements and affordability. The company entered into a two-year collaboration partnership agreement with organised labour in June 2016. The agreement will expire on 31 March 2018. As part of this agreement, no fixed salary increases were implemented for FY2017 and a 6 percent salary increase for FY2018 based on market functional areas’ 50th percentile will be implemented.
Telkom introduced a variable-based incentive scheme for bargaining unit employees, known as Performance Pays. Performance Pays focuses on customer satisfaction and productivity metrics, and replaces the current STI scheme, which is primarily driven by group financial performance. This empowers and enables bargaining unit employees to be more in control of their own destiny and rewards, and gives more direct and clear linkage between individuals’ efforts and their monthly pay.
The Performance Pays incentives vary between 0 percent and 9 percent based on individual performance and are payable per quarter. In addition, employees who perform at or above a three performance rating each year, will each receive a ‘14th cheque’, payable in June 2017. This 14th cheque will be calculated based on individual total package value subject to the company meeting its financial performance targets.
Benchmarking
Executive compensation is benchmarked to data provided in national executive compensation surveys, and information disclosed in the annual reports of companies listed on the JSE.
Ensuring an appropriate peer group to retain the integrity and appropriateness of the benchmark data is a key task of the remco. Executive pay is benchmarked annually.
Telkom introduced a variable-based incentive scheme for bargaining unit employees, known as Performance Pays. Performance Pays focuses on customer satisfaction and productivity metrics, and replaces the current STI scheme, which is primarily driven by group financial performance.
Performance management
Introduction
Telkom embarked on a performance management initiative in order to review the system and processes.
The focus is on defining key performance indicators (KPIs) for the GCEO, MDs and their direct reports, as well as the frontline staff. The purpose of the initiative is to implement a high-performance management culture that is outcome-oriented, consistent, simple and practical.
A monthly/weekly dashboard will be used to manage the business units and the focus will be on five to 10 critical and consistent KPIs (based on priorities which may change throughout the year).
| Overall performance management process | |||||||
Clear process definition
|
Compliance
|
Rewards and consequences
|
|||||
| Transparency on bonus ranges, calibration and bonus pool | |||||||
Principles for KPI design and cascading include:
- Strategic - KPIs (flight plan) must be aligned with group strategy and financial objectives, and must contain a mix of customer, financial, operational and people metrics
- Focused - Metrics per individual are limited to between four and six KPIs (spread across categories). There should be at least one or two relevant shared/team KPIs (for example, consumer EBITDA)
- Practical - Employees must be able to directly influence their KPIs (other than group/BU KPIs). New KPI system was implemented from 1 June 2016
GCEO
The GCEO is rewarded on the delivery of the strategic and operational objectives in line with shareholder expectations and business strategy. The remuneration strategy for the GCEO is designed to align remuneration with long-term shareholder growth and sustainable profitability. The reward should demonstrate the critical and pivotal role the GCEO plays in the achievement of the company’s strategic objectives and operational goals. The following key performance areas were contracted with the GCEO:
| Weighting | Category | Key metrics | |||||
| 40% | Financial |
|
|||||
| 25% | Executing key strategic milestones |
|
|||||
| 20% | Customer experience |
|
|||||
| 15% | People goals (leadership and employees) |
|
GCFO
The following key performance areas were contracted with the GCFO:
| Weighting | Category | Key metrics | |||||
| 40% | Financial |
|
|||||
| 25% | Executing key strategic milestones |
|
|||||
| 20% | Customer experience |
|
|||||
| 15% | People goals (leadership and employees) |
|
The STI component is an incentive that rewards the achievement of annual performance targets for management employees.
STIs
Introduction
The level of achievement determines the level of payment against each weighted company performance measure. The STI plan is designed and aligned with shareholder expectations.
It emphasises a remuneration policy that is performance driven, supports alignment between senior management and shareholders, and links STI to company performance.
The FY2017 plan was approved by remco and the board, with the following clearly defined principles:
- Both EBITDA and Profit after tax (PAT) targets must be achieved at the group company level to trigger any STI payment.
- No STI will be payable if the achievement is less than the hurdle rate.
| STIs | ||||
STIs comprise cash payment that is payable after finalisation of audited results
|
Bargaining unit employees, employees who perform at or above a three performance rating received a 14th cheque. | |||
Telkom introduced a 25 percent interim STI payment for all management employees based on the achievement of interim EBITDA and PAT targets.
The size of the STI pool will depend on the achievement of PAT measures and will be variable. In line with the remuneration policy, the overall company performance will be measured at company, business unit and divisional level as indicated below.
| Business unit | Corporate centre | Total | |||||||
| Group financials | 20% | 20% | 20% | ||||||
| Business unit/corporate centre | 60% | 60% | 80% | ||||||
| Divisional | 20% | 20% | |||||||
| Total | 100% | 100% | 100% |
The rules, targets and measurements are tabled annually on the recommendation of remco to the board for approval, subject to the actual audited company performance reflected in the plan under review.
STIs plan awarded for FY2017
In accordance with the approved company STI plan, STIs were allocated to business units based on their actual achievement and divisional performance. Individual performance is recognised in the respective business units based on the achievement of individual performance contracts. FY2017 STI targets and achievements (excluding BCX and Trudon) are shown below:
Interim results
| Performance criteria | Plan weighting % |
Interim target FY2017* Rm |
Actual FY2017* achievement Rm |
Percent achievement (%) |
|||||||||
| PAT | 50 | 1 428 | 1 923 | 134.7% | |||||||||
|---|---|---|---|---|---|---|---|---|---|---|---|---|---|
| EBITDA | 50 | 4 615 | 5 311 | 5.1% |
Final annual result
| Performance criteria | Plan weighting % | Baseline FY2016 Rm |
Target FY2017 RM |
Actual FY2017* achievement |
Percent achievement (%) |
|||||||||||
| PAT | 50 | 2 306 | 2 117 | 3 224 | 152.3 | |||||||||||
|---|---|---|---|---|---|---|---|---|---|---|---|---|---|---|---|---|
| EBITDA | 50 | 8 424 | 8 344 | 9 005 | 107.9 |
* The target and achievements exclude the results of BCX and Trudon.
Telkom’s share incentive plans are structured to optimise the company’s overall position, while providing benefits that will assist the company to attract, retain and incentivise executives and top talented employees.
LTIs
Introduction
The plan is designed to support the principle of alignment between management and shareholder interests, with the ultimate aim of ensuring growth in shareholder value. The objectives are to motivate long-term sustainable performance, align the interests of top management with those of shareholders, and retain business-critical and top talented employees. In terms of the forfeitable share plan (FSP), a free transfer of shares is awarded to employees, under the condition of forfeiture in the case of termination of service before the vesting/release date; and achievement of the company’s pre-determined performance levels.
From the grant date, the employee has shareholder rights in respect of the forfeitable shares to receive dividend rights and voting rights. The Telkom LTI plan is an FSP, which has two components:
- LTI plan component (senior leadership, M3 to M0)
- ESOP component (middle management and bargaining unit, A to M/S4)
| LTI | |||||||
Long-term incentives
|
LTI plan component (M3 – M0) | ESOP (A – M4) | |||||
Vesting of awards
The performance conditions are measured after three years and the number of shares to vest is based on the extent to which the performance conditions are met.
| Vesting period: LTI Plan | |||||||||||||||||||||||
| Award (M3 - M0) | FY2016 | FY2017 | FY2018 | FY2019 | FY2020 | FY2021 | Total | ||||||||||||||||
| FY2013 | 50% | 30% | 20% | 100% | |||||||||||||||||||
|---|---|---|---|---|---|---|---|---|---|---|---|---|---|---|---|---|---|---|---|---|---|---|---|
| FY2014 | 50% | 30% | 20% | 100% | |||||||||||||||||||
| FY2015 | 50% | 30% | 20% | 100% | |||||||||||||||||||
| FY2016 | 50% | 30% | 20% | 100% | |||||||||||||||||||
| Total | 50% | 80% | 100% | 100% | 50% | 20% | |||||||||||||||||
| Vesting period: ESOP | |||||||||||||||||
| Award (A - M4) | FY2016 | FY2017 | FY2018 | FY2019 | Total | ||||||||||||
| FY2013 | 100% | 100% | |||||||||||||||
| FY2014 | 100% | 100% | |||||||||||||||
| FY2015 | 100% | 100% | |||||||||||||||
| FY2016 | 100% | 100% | |||||||||||||||
| Total | 100% | 100% | 100% | 100% |
The following performance condition was set for the vesting of the FY2017 share awards, which were awarded in June 2016:
- Participants in the ESOP will only be measured on operational targets on which they have a direct influence.
| Category | Performance condition |
Weight | Target - Rand value | ||||||||||||||||||||
| F2017 | F2018 | F2019 | F2020 | F2021 | |||||||||||||||||||
| Financial 70% | Total shareholder return (TSR) |
20% | Risk free* +4% |
Risk free* +4% |
Risk free* +4% |
Risk free* +4% |
Risk free* +4% |
||||||||||||||||
| HEPS | 30% | As per the business plan | |||||||||||||||||||||
| Free cash flow (FCF) |
10% | As per the business plan | |||||||||||||||||||||
| Return on invested capital |
10% | As per the business plan | |||||||||||||||||||||
| Operational 30% | Customer first | ||||||||||||||||||||||
| Customer Loyalty Measure (CLM) – Telkom overall quality (Revenue weighted composite score) |
15% | 62.1% | 63.8% | 65.2% | 66.6% | 66.6% | |||||||||||||||||
| Baseline 58.6 (FY2015) | |||||||||||||||||||||||
| TSA 100 Index | 15% | Composite score: 1 | Composite score: 1 | Composite score: 1 | Composite score: 1 | Composite score: 1 | |||||||||||||||||
|
|||||||||||||||||||||||
|
Threshold: 0.90 | Threshold: 0.90 | Threshold: 0.90 | Threshold: 0.90 | Threshold: 0.90 | ||||||||||||||||||
| * | Risk-free rate: Government bond (R203) with a three-year term to maturity to correspond with term of vesting. A risk-free rate of 7.34 percent plus 4 percent equates to a CPI plus 5.74 percent (real return). |
Total number of shares issued up to 31 March 2017
| Year awarded | FY2014 | FY2015 | FY2016 | FY2017 | ||||||||||
| Date awarded | November 2013 | April 2015 | June 2015 | June 2016 | ||||||||||
| Total number of shares available | 26 039 195 | 19 479 905 | 14 794 171 | 10 061 728 | ||||||||||
| Shares awarded | 6 559 290 | 4 685 734 | 4 732 443 | 4 886 209 | ||||||||||
| Remaining shares available for future allocations | 19 479 905 | 14 794 171 | 10 061 728 | 5 175 519 |
Total number of shares may fluctuate annually based on forfeiture of shares due to non-performance and resignations, and vesting of shares due to the achievement of performance conditions and pro-rata vesting for good leavers.
Vesting of 2013 forfeitable shares
In accordance with the Telkom FSP, the following shares vested in 2016 based on the achievement of the following performance vesting condition:
- Additional shares award (ASA) for exco members
100 percent if a share price of R50 is achieved after the three-year performance period – the full award vested based on the actual achievement of the performance condition:
Vesting of 2013 forfeitable shares – Performance conditions achieved
| ASA award price | ASA target price | Share price as at 31 March 2016 | |||||
| R23.80 | R50.00 | R57.57 |
- LTI Plan (M0 to M3 level management employees):
50 percent of the shares vested in 2016 subject to the extent that the TSR was met over the three-year performance period:
| Year | TSR target | TSR achievement | Percent achieved | ||||||||
| March 2014 | RFR (6 percent) +6 percent on a share price of R27.30 (19/11/2013) |
R33.65 | 23% | ||||||||
| March 2015 | RFR (6 percent) +6 percent on a share price of R27.30 (19/11/2013) |
R80.00 | 193% | ||||||||
| March 2016 | RFR (6 percent) +6 percent on a share price of R27.30 (19/11/2013) |
R57.57 + R2.45 dividend declaration | 120% |
The full 50 percent forfeitable shares vested for qualifying employees.
- ESOP (M4 – A level employees):
100 percent of forfeitable shares will vest in year three based on achievements of NPS - customer index
| Segment: NPS | Actual 2013/14 | Actual 2014/15 | Actual 2015/16 | Target 2015/16 | Target achieved | ||||||||||||
| Total Telkom composite score | 9 | 5.7 | 3.8 | 6.6 | No |
NPS target was not met and therefore, 0 percent of the ESOP shares vested.
A total of 796 224 forfeitable shares vested (excluding shares that vested to good leavers) on 6 June 2016 at a share price of R59.63
- ASA – 133 341 shares
- LTI Plan – 637 811 shares
- ESOP – 0 shares
- Performance shares – 25 072 shares

Employment contracts
Introduction
Employment contracts exist which require three months’ notice of termination by the employee and three months’ notice of termination by the company.
The retirement age for executive directors is 65 years. A standard restraint of trade clause is incorporated into the employment contract for a maximum of three months without reward.
All exco members are employed on a full-time employment contract except for LM de Villiers and A Vitai, who are on fixed-term contracts expiring on 1 March 2018 and 1 March 2019 respectively.
External directorships
Executive directors are allowed to hold one external directorship in any company subject to prior board approval. All compensation earned from external directorships will accrue to Telkom. The board may decline external directorships as it may deem appropriate.
Section |
Telkom’s share incentive plans are structured to optimise the company’s overall position, while providing benefits that will assist the company to attract, retain and incentivise executives and top talented employees.
The Performance Pays incentives vary between 0 percent and 12 percent based on individual performance and are payable per quarter. In addition, employees who perform at or above a three performance rating each year, will each receive a ‘14th cheque’, payable in June 2017.
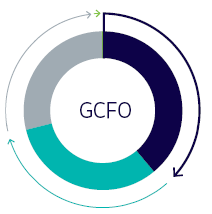
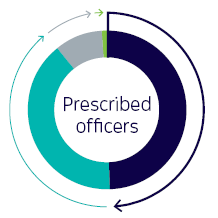
Pay mix for executive directors and prescribed officers

- 37.20%LTI
- 34.02%STI
- 28.73%Guaranteed
total package - 0.05%Fringe and
other benefits
- 38.93%Guaranteed
total package - 32.38%STI
- 28.60%LTI
- 0.09%Fringe and
other benefits
- 49.52%Guaranteed
total package - 39.61%STI
- 9.89%LTI
- 0.98%Fringe and
other benefits
Executive directors’ remuneration
Remuneration and benefits paid and STIs approved in respect of the 2017 financial year are set out in the following table.
| Rand | Guaranteed package |
STI* | Fringe and other benefits |
LTI (vested shares) |
Total 2017 | Total 2016 | |||||||||||||
| Executive directors | |||||||||||||||||||
| SN Maseko | 7 441 200 | 8 813 911 | 11 997 | 9 637 818 | 25 904 926 | 14 510 729 | |||||||||||||
| DJ Fredericks | 5 250 000 | 4 365 753 | 11 997 | 3 857 167 | 13 484 917 | 9 456 765 | |||||||||||||
| Total | 12 691 200 | 13 179 665 | 23 993 | 13 494 985 | 39 389 842 | 23 967 494 |
Prescribed officers’ remuneration (excluding executive directors)
The aggregate remuneration, benefits paid and STIs and LTIs approved for the 2017 financial year are set out in the following table. Executive and prescribed officers’ emoluments are set out in the financial statements in note 39.
2017 emoluments per prescribed officer
| Company | Remuneration* R |
Incentive bonus R |
Fringe and other benefits** R |
LTI (vested shares) R |
Total R |
Pension – TRF 13 percent*** Rm |
|||||||||||||
| BC Armstrong | 5 001 345 | 4 249 353 | 11 997 | 1 037 264 | 10 299 959 | 319 086 | |||||||||||||
|---|---|---|---|---|---|---|---|---|---|---|---|---|---|---|---|---|---|---|---|
| LM de Villiers | 3 288 448 | 2 681 058 | 11 997 | 3 635 999 | 9 617 502 | 447 229 | |||||||||||||
| AN Samuels | 4 500 000 | 4 433 738 | 11 997 | – | 8 945 735 | 339 300 | |||||||||||||
| IM Russell | 4 153 353 | 4 103 244 | 11 997 | 1 236 249 | 9 504 843 | 323 961 | |||||||||||||
| J Henning1 | 1 900 000 | 594 660 | 96 371 | 921 224 | 3 512 255 | 172 841 | |||||||||||||
| A Vitai | 5 830 000 | 5 777 314 | 11 997 | – | 11 619 311 | – | |||||||||||||
| NM Lekota2 | 266 667 | 179 207 | – | – | 445 874 | 28 000 | |||||||||||||
| I Mophatlane | 5 804 827 | 5 341 562 | 519 909 | – | 11 666 298 | 246 371 | |||||||||||||
| T Seopa | 3 460 184 | – | – | – | 3 460 184 | 260 898 | |||||||||||||
| Total | 34 204 823 | 27 360 137 | 676 265 | 6 830 736 | 69 071 961 | 2 137 686 |
2016 emoluments per prescribed officer
| Company | Remuneration* R |
Incentive bonus R |
Fringe and other benefits** R |
Total R |
Pension – TRF 13 percent*** Rm |
|||||||||||
| BC Armstrong | 5 001 345 | 3 340 323 | 481 830 | 8 823 498 | 455 122 | |||||||||||
| LM De Villiers | 3 288 448 | 2 051 514 | 321 557 | 5 661 519 | 447 229 | |||||||||||
| TE Msubo3 | 1 383 071 | – | 317 475 | 1 700 546 | 107 880 | |||||||||||
| GJ Rasethaba3 | 1 192 156 | 692 669 | 274 338 | 2 159 163 | 89 888 | |||||||||||
| AN Samuels | 4 291 667 | 3 489 288 | 350 649 | 8 131 604 | 524 667 | |||||||||||
| V Scarcella3 | 1 430 000 | 1 011 458 | 329 038 | 2 770 496 | 111 540 | |||||||||||
| IM Russell | 4 153 353 | 3 000 011 | 402 977 | 7 556 341 | 323 961 | |||||||||||
| MA Altman3 | 1 197 396 | 347 857 | 272 522 | 1 817 775 | 124 529 | |||||||||||
| IC Coetzee | 1 039 819 | 625 000 | 738 597 | 2 403 416 | 78 402 | |||||||||||
| J Henning4 | 1 295 455 | 1 091 071 | 11 997 | 2 398 523 | – | |||||||||||
| A Vitai4 | 2 650 000 | 1 911 922 | 11 997 | 4 573 919 | – | |||||||||||
| Total | 26 922 710 | 17 561 113 | 3 512 977 | 47 996 800 | 2 263 218 |
| Rand | Guaranteed package |
Short-term incentive |
Long-term incentive |
Fringe and other benefits |
Total FY2017 |
Total FY2016 |
|||||||||||||
| Executive management team | 97 994 421 | 57 542 795 | 23 595 644 | 21 661 733 | 200 794 593 | 167 580 855 | |||||||||||||
|---|---|---|---|---|---|---|---|---|---|---|---|---|---|---|---|---|---|---|---|
| Number of employees | 47 | 41 |
| *Remuneration has been apportioned based on the period served as prescribed officers. Comparative information has been provided for members identified as prescribed officers. ** Fringe and other benefits include motor car insurance and flexible allowance. *** The pension contribution is a company contribution. |
| 1 Stepped down following merger of enterprise with BCX. 2 Appointed to exco 1 March 2017. 3 Ceased to be prescribed officers on 31 August 2015. 4 Appointed to exco 19 October 2015. |
Non-executive directors’ fees
Non-executive directors’ remuneration key principles and policies
The board of directors, on the recommendation of Remco, determines the fees of the non-executive directors.
Fees for Telkom’s non-executive directors are determined by the board based on market practice, within the restrictions contained in Telkom’s MOI. Telkom’s non-executive directors receive no pay or benefits other than directors’ fees, with the exception of reimbursement of expenses incurred in connection with their directorships. The non-executive directors participate in neither the LTI share plan nor the STI plan outlined herein, and are not eligible for pension scheme membership.
The remuneration structure is considered to be fair and reasonable and in the best interest of the company.
| FY2017 Rm |
FY2016 Rm |
|||||||
| Chair of the board | 1 250 000 | 1 250 000 | ||||||
|---|---|---|---|---|---|---|---|---|
| Non-executive director of the board | 366 000 | 366 000 | ||||||
| International board member | 505 408 | 505 408 | ||||||
| Audit committee chair | 220 600 | 220 600 | ||||||
| Audit committee member | 134 900 | 134 900 | ||||||
| Remuneration committee chair | 200 000 | 200 000 | ||||||
| Remuneration committee member | 120 000 | 120 000 | ||||||
| Nominations committee chair | 133 050 | 133 050 | ||||||
| Nominations committee member | 90 000 | 90 000 | ||||||
| Investment and transactions committee chair | 138 138 | 138 138 | ||||||
| Investment and transactions committee member | 90 000 | 90 000 | ||||||
| Social and ethics committee chair | 200 000 | 200 000 | ||||||
| Social and ethics committee member | 120 000 | 120 000 | ||||||
| Risk committee chair | 200 000 | 200 000 | ||||||
| Risk committee member | 120 000 | 120 000 |
Refer to note 39 of the consolidated annual financial statements (available online) for fees paid to non-executive directors during the year.
| Committee | Scheduled meetings | Fee per meeting | Special meetings | Fee per meeting | ||||||||||||||
| Board | 5 | Annual retainer | 2 | Chairman: R23 400 | ||||||||||||||
| Audit | 6 | Chairman: R55 150 Member: R33 725 |
1 | Board members: R17 500 | ||||||||||||||
| Risk | 4 | Chairman: R50 000 Member: R30 000 |
– | |||||||||||||||
| Remuneration | 4 | Chairman: R50 000 Member: R30 000 |
1 | |||||||||||||||
| Nominations | 3 | Chairman: R44 350 Member: R30 000 |
2 | |||||||||||||||
| Investment and transactions | 4 | Chairman: R46 046 Member: R30 000 |
4 | |||||||||||||||
| Social and ethics | 4 | Chairman: R50 000 Member: R30 000 |
– |
Where any board member voluntarily attends a meeting of a committee of which he/she is not a member, there is no
attendance fee payable. All fees are paid proportionally to the period in which office is held.
Beneficial shareholding
Directors’ shareholding as at 31 March 2017
| Directors’ interest and prescribed officers | Beneficial | Non-beneficial | |||||||||||
| Direct | Indirect | Direct | Indirect | ||||||||||
| Group and company | |||||||||||||
| Number of shares | |||||||||||||
| Directors' shareholding | |||||||||||||
| 2017 | |||||||||||||
| Executive | |||||||||||||
| SN Maseko | 52 520 | – | – | – | |||||||||
| DJ Fredericks | 48 7111 | 267 | – | – | |||||||||
| 101 231 | 267 | – | – | ||||||||||
| Non-executive | |||||||||||||
| JA Mabuza | 26 000 | – | – | – | |||||||||
| I Kgaboesele | 12 000 | – | – | – | |||||||||
| KW Mzondeki | 267 | – | – | – | |||||||||
| 38 267 | – | – | – | ||||||||||
The beneficial interest for one of our executive directors, DJ Fredericks, has increased from 9 607 to 48 711 in
July 2016. In terms of the Telkom share plan and as disclosed in our FY2016 integrated report, 64 685 shares vested
for DJ Fredericks and he disposed of 25 581 shares on 5 July 2016. The balance of 39 104 shares added to the
9 607 shares which he already held brought his total shares to 48 711.
There have been no changes in the above since 31 March 2017 to the date of approval of the consolidated annual financial statements.
| Directors’ interest and prescribed officers | Beneficial | Non-beneficial | |||||||||||
| Direct | Indirect | Direct | Indirect | ||||||||||
| 2016 | |||||||||||||
| Executive | |||||||||||||
| SN Maseko | 52 520 | – | – | – | |||||||||
| DJ Fredericks | 9 607 | 267 | – | – | |||||||||
| 62 127 | 267 | – | – | ||||||||||
| Non-executive | |||||||||||||
| JA Mabuza | 26 000 | – | – | – | |||||||||
| F Petersen-Lurie | – | – | – | 400 | |||||||||
| I Kgaboesele | 12 000 | – | – | – | |||||||||
| KW Mzondeki | 267 | – | – | – | |||||||||
| 38 267 | – | – | 400 | ||||||||||
In terms of the Telkom share plan 161 627 and 64 685 shares vested for SN Maseko and DJ Fredericks respectively. On 4 July 2016 SN Maseko disposed of 145 907 shares. On 5 July 2016, SN Maseko and DJ Fredericks disposed of
15 720 and 25 581 shares respectively.
Shares awarded
| Year of the award |
Shares awarded |
Share award price R |
Face value of award R |
Vested shares |
|||||||||||
| SN Maseko | |||||||||||||||
| FSP | 2013 | 163 866 | 23.80 | 3 900 011 | 81 933 | ||||||||||
| ASA | 2013 | 54 622 | 23.80 | 1 300 004 | 54 622 | ||||||||||
| FSP | 2014 | 138 352 | 76.11 | 10 529 971 | – | ||||||||||
| FSP | 2015 | 150 428 | 74.20 | 11 161 758 | – | ||||||||||
| Performance shares | 2015 | 50 143 | 74.20 | 3 720 611 | 25 072 | ||||||||||
| FSP | 2016 | 197 066 | 56.64 | 11 161 818 | – | ||||||||||
| Performance shares | 2016 | 65 689 | 56.64 | 3 720 625 | – | ||||||||||
| Total | 820 166 | 45 494 798 | 161 627 | ||||||||||||
| DJ Fredericks | |||||||||||||||
| FSP | 2013 | 74 898 | 23.80 | 1 782 572 | 37 449 | ||||||||||
| ASA | 2013 | 27 236 | 23.80 | 648 217 | 27 236 | ||||||||||
| FSP | 2014 | 86 705 | 76.11 | 6 599 118 | – | ||||||||||
| FSP | 2015 | 53 066 | 74.20 | 3 937 497 | – | ||||||||||
| FSP | 2016 | 69 043 | 57.03 | 3 937 522 | – | ||||||||||
| Total | 310 948 | 16 904 926 | 64 685 | ||||||||||||
| BC Armstrong | |||||||||||||||
| FSP | 2013 | 15 126 | 23.80 | 359 999 | 7 563 | ||||||||||
| ASA | 2013 | 9 832 | 23.80 | 234 002 | 9 832 | ||||||||||
| FSP | 2014 | 82 717 | 76.11 | 6 295 591 | – | ||||||||||
| FSP | 2015 | 50 553 | 74.20 | 3 751 033 | – | ||||||||||
| FSP | 2016 | 65 773 | - | 3 751 034 | – | ||||||||||
| Total | 224 001 | 14 391 658 | 17 395 | ||||||||||||
| LM de Villiers | |||||||||||||||
| FSP | 2013 | 70 603 | 23.80 | 1 680 351 | 35 302 | ||||||||||
| ASA | 2013 | 25 674 | 23.80 | 611 041 | 25 674 | ||||||||||
| FSP | 2014 | 54 569 | 76.11 | 4 153 247 | – | ||||||||||
| FSP | 2015 | 33 239 | 74.20 | 2 466 334 | – | ||||||||||
| FSP | 2016 | 43 246 | 57.03 | 2 466 319 | – | ||||||||||
| Total | 227 331 | 11 377 292 | 60 976 | ||||||||||||
| AN Samuels | |||||||||||||||
| FSP | 2014 | 55 629 | 76.11 | 4 233 923 | – | ||||||||||
| FSP | 2015 | 40 431 | 74.20 | 2 999 980 | – | ||||||||||
| FSP | 2016 | 59 179 | 57.03 | 3 374 978 | – | ||||||||||
| Total | 155 239 | 10 608 882 | |||||||||||||
| IM Russell | |||||||||||||||
| FSP | 2013 | 24 005 | 30.35 | 728 552 | 12 003 | ||||||||||
| ASA | 2013 | 8 729 | 30.35 | 264 925 | 8 729 | ||||||||||
| FSP | 2014 | 68 922 | 76.11 | 5 245 653 | – | ||||||||||
| FSP | 2015 | 41 981 | 74.20 | 3 114 990 | – | ||||||||||
| FSP | 2016 | 54 621 | 57.03 | 3 115 036 | – | ||||||||||
| Total | 198 258 | 12 469 156 | 20 732 | ||||||||||||
| A Vitai | |||||||||||||||
| FSP | 2013 | – | – | – | – | ||||||||||
| ASA | 2013 | – | – | – | – | ||||||||||
| FSP | 2014 | 95 374 | 76.11 | 7 258 915 | – | ||||||||||
| FSP | 2015 | 58 929 | 74.20 | 4 372 532 | – | ||||||||||
| FSP | 2016 | 76 670 | 57.03 | 4 372 490 | – | ||||||||||
| Total | 230 973 | 16 003 937 | |||||||||||||
| J Henning | |||||||||||||||
| FSP | 2013 | 30 897 | 23.80 | 735 349 | 15 449 | ||||||||||
| ASA | 2013 | – | – | – | – | ||||||||||
| FSP | 2014 | 23 680 | 76.11 | 1 802 285 | – | ||||||||||
| FSP | 2015 | 13 443 | 74.20 | 997 471 | – | ||||||||||
| FSP | 2016 | 17 491 | 57.03 | 997 512 | – | ||||||||||
| Total | 85 511 | 4 532 616 | 15 449 | ||||||||||||
| NM Lekota | |||||||||||||||
| FSP | 2016 | 21 042 | 57.03 | 1 200 025 | – | ||||||||||
| Total | 21 042 | 1 200 025 | |||||||||||||
| LI Mophatlane | |||||||||||||||
| FSP | 2016 | 255 384 | 65.34 | 16 686 791 | – | ||||||||||
| Total | 255 384 | 16 686 791 | |||||||||||||
| TS Seopa | |||||||||||||||
| FSP | 2016 | 147 805 | 70.23 | 10 380 552 | – | ||||||||||
| Total | 147 805 | 10 380 552 |
| Vesting date |
Vesting price R |
Value of vested shares R |
Closing number |
|||||||||
| SN Maseko | ||||||||||||
| FSP | 2016-06-06 | 59.63 | 4 885 665 | 81 933 | ||||||||
| ASA | 2016-06-06 | 59.63 | 3 257 110 | - | ||||||||
| FSP | – | – | – | 138 352 | ||||||||
| FSP | – | – | – | 150 428 | ||||||||
| Performance shares | 2016-06-06 | 59.63 | 1 495 043 | 25 071 | ||||||||
| FSP | – | – | – | 197 066 | ||||||||
| Performance shares | – | – | – | 65 689 | ||||||||
| Total | 9 637 818 | 658 539 | ||||||||||
| DJ Fredericks | ||||||||||||
| FSP | 2016-06-06 | 59.63 | 2 233 084 | 37 449 | ||||||||
| ASA | 2016-06-06 | 59.63 | 1 624 083 | – | ||||||||
| FSP | – | – | – | 86 705 | ||||||||
| FSP | – | – | – | 53 066 | ||||||||
| FSP | – | – | – | 69 043 | ||||||||
| Total | 3 857 167 | 246 263 | ||||||||||
| BC Armstrong | ||||||||||||
| FSP | 2016-06-06 | 59.63 | 450 982 | 7 563 | ||||||||
| ASA | 2016-06-06 | 59.63 | 586 282 | – | ||||||||
| FSP | – | – | – | 82 717 | ||||||||
| FSP | – | – | – | 50 553 | ||||||||
| FSP | – | – | – | 65 773 | ||||||||
| Total | 1 037 264 | 206 606 | ||||||||||
| LM de Villiers | ||||||||||||
| FSP | 2016-06-06 | 59.63 | 2 105 058 | 35 301 | ||||||||
| ASA | 2016-06-06 | 59.63 | 1 530 941 | – | ||||||||
| FSP | – | – | – | 54 569 | ||||||||
| FSP | – | – | – | 33 239 | ||||||||
| FSP | – | – | – | 43 246 | ||||||||
| Total | 3 635 999 | 166 355 | ||||||||||
| AN Samuels | ||||||||||||
| FSP | – | – | – | 55 629 | ||||||||
| FSP | – | – | – | 40 431 | ||||||||
| FSP | – | – | – | 59 179 | ||||||||
| Total | 155 239 | |||||||||||
| IM Russell | ||||||||||||
| FSP | 2016-06-06 | 59.63 | 715 739 | 12 002 | ||||||||
| ASA | 2016-06-06 | 59.63 | 520 510 | – | ||||||||
| FSP | – | – | – | 68 922 | ||||||||
| FSP | – | – | – | 41 981 | ||||||||
| FSP | – | – | – | 54 621 | ||||||||
| Total | 1 236 249 | 177 526 | ||||||||||
| A Vitai | ||||||||||||
| FSP | – | – | – | – | ||||||||
| ASA | – | – | – | – | ||||||||
| FSP | – | – | – | 95 374 | ||||||||
| FSP | – | – | – | 58 929 | ||||||||
| FSP | – | – | – | 76 670 | ||||||||
| Total | 230 973 | |||||||||||
| J Henning | ||||||||||||
| FSP | 2016-06-06 | 59.63 | 921 224 | 15 448 | ||||||||
| ASA | 2016-06-06 | – | – | – | ||||||||
| FSP | – | – | – | 23 680 | ||||||||
| FSP | – | – | – | 13 443 | ||||||||
| FSP | – | – | – | 17 491 | ||||||||
| Total | 921 224 | 70 062 | ||||||||||
| NM Lekota | ||||||||||||
| FSP | – | – | – | 21 042 | ||||||||
| Total | 21 042 | |||||||||||
| LI Mophatlane | ||||||||||||
| FSP | – | – | – | 255 384 | ||||||||
| Total | 255 384 | |||||||||||
| TS Seopa | ||||||||||||
| FSP | – | – | – | 147 805 | ||||||||
| Total | 147 805 |