

- Page tools


Financial capital
Key highlights
Group operating revenue up |
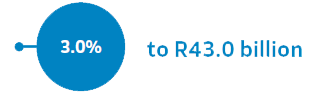 |
Mobile service revenue up |
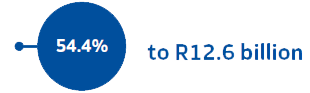 |
Mobile direct cost to revenue ratio improves to |
 |
Free cash flow (FCF) up |
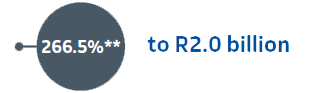 |
Net debt to EBITDA improves to |
 |
| * | The indicators are based on a pro forma IAS 17 basis and exclude VSP/VERP costs of R1 186 million and the related tax impact of R332 million, and the additional provision relating to the impairment of accounts receivable and contract assets as a result of COVID-19 of R626 million and the related tax impact of R175 million. FY2019 excludes VSP, VERP and section 189 costs of R728 million and the related tax impact of R215 million. |
| ** | FCF excludes R175 million paid for VSP, VERP and section 189 costs during FY2020 and R566 million in the comparative year. |