

- Page tools


Group Chief Financial Officer's report
Financial resilience in a difficult trading environment.
The financial year under review was characterised by an exceptionally weak economy, with the country slipping into a technical recession, exacerbated by uncertainty caused by COVID-19, ongoing competitive threats and an uncertain regulatory environment.
Despite the challenging trading environment, the group achieved solid performance with a 3% growth in operating revenue, primarily driven by the strong growth in mobile service revenue. Through our sustainable cost management programme we were able to minimise the impact of high-margin fixed-voice revenue decline on EBITDA. It is pleasing that our cash release initiatives in the second half of the year, underpinned by a threefold improvement in FCF enabled us to strengthen our balance sheet.
We remain confident that despite the heightened uncertainty due to the impact of COVID-19, our continued focus on financial resilience measures will enable us to weather the volatile trading environment.
Key factors impacting financial performance
COVID-19 impact |
We took a prudent approach and raised an additional impairment of R626 million on trade receivables to take account of the impact of COVID-19. Despite the expected economic challenges, the group has not seen a deterioration in its debtors’ book performance since the national lockdown. |
||
IFRS 16 adoption |
The adoption of the accounting statement on leases, IFRS 16 effective from 1 April 2019 resulted in an EBITDA uplift of R1.1 billion. |
||
VSP and VERP |
We implemented phase one of the restructuring programme and recognised a provision of R1 186 million in FY2020. The payments relating to the restructuring were made in April 2020. |
Key themes from Telkom’s financial performance
IFRS 16 adoption
The group adopted IFRS 16 (Leases) with effect from 1 April 2019. The group adopted the new standard retrospectively, but has not restated comparatives, as permitted under the specific transitional provisions in the standard. Therefore, the prior periods are still reported under IAS 17.
March 2020
| Category | IAS 17 (previous standard) | IFRS 16 (new standard) | Impact | ||||||
| Balance sheet | Lease smoothing receivable/payable | Recognise right of use of asset |
R4.5 billion | ||||||
| Recognise lease liability | R4.8 billion | ||||||||
| Income statement | Operating lease on straight-line basis in operating expenses | Reduced operating lease (higher EBITDA) | R1 084 million | ||||||
| Depreciation on right-of-use asset | (R954 million) | ||||||||
| Interest expense on lease liabilities | (R368 million) | ||||||||
| Profit after tax (PAT) | (R171 million) | ||||||||
| HEPS | (34.4 cents) | ||||||||
| Cash flow | Lease payment in operating activities | Lease payment in financing activities | Reclassification on cash flow statement | ||||||
| Net debt/ EBITDA | Operating lease payment in EBITDA | Higher EBITDA Higher net debt |
Increased by 0.4x to 1.3x |
Revenue growth driven by new revenue streams
New revenue streams offset decline in traditional fixed business
Our continued investment in key growth areas underpins the growth in our new revenue streams. Mobile service revenue grew 54.4% from R8.2 billion to R12.6 billion underpinned by a 22% growth in capital investment in support of the 2.3 million subscriber growth. The growth in mobile was partially offset by the 22.2% decline in fixedvoice revenue and 13.5% decline to R7 billion in traditional fixed data revenue driven by the continued migration from copper-based to next-generation technologies.
Revenue from next-generation technologies grew 14.3% to R2.4 billion as customers migrate to newer technologies. With the launch of the Pure Connect product in May 2020, we anticipate mitigating the churn on our traditional data products. It is pleasing that all new revenue streams grew in FY2020.
IT business revenue grew by 1.8% despite the tough trading environment. The marginal growth in IT business revenue was largely due to a 22% increase in hardware sales, taking advantage of customer hardware refresh cycle, and an increase in application solutions of 3.1% in line with the drive to grow industry-specific owned intellectual property revenue. This growth in IT was partially offset by a 2.5% decline in IT services revenue, which was negatively impacted by the disposal of the Tanzania and Nigeria businesses and declines in hosting services revenues as demand fell for traditional hosting platforms. Gyro’s external revenue increased by 6.9%, driven by our masts and towers portfolio, as the demand for external leases increases.
Effective cost management
We continued to focus on cost containment, enabling us to minimise the impact of fixedvoice revenue decline on EBITDA
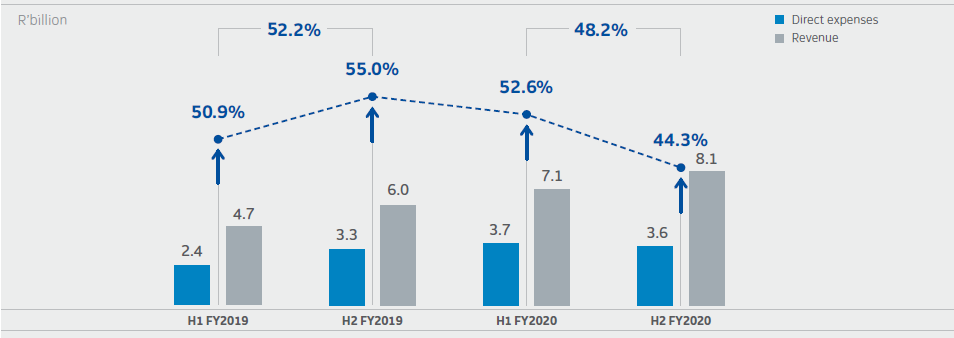
Although our direct expenses for the group grew by 17.6% overall in support of the mobile subscriber growth of 23.9% to 12 million, our relentless focus to reduce mobile direct costs in the second half of the year delivered positive results as shown in the graph alongside. Mobile direct cost to revenue ratio decreased from 55% in H2 of FY2019 to 44.3% in H2 of FY2020. This was achieved through efforts in reducing the cost to acquire/serve, renegotiating contracts with dealers, optimising the network and the rollout of deep passive sharing sites.
Mobile direct expenses to revenue ratio
From an operating expenditure (opex) perspective, Telkom contained the growth in group opex to below inflation. This was primarily due to a number of efforts in line with our sustainable cost management programme.
Firstly, we were able to realise the benefits of the restructuring programme implemented in FY2019, partially offset by a 6% salary increase implemented in FY2020.
Secondly, the investments we are making in modernising our network enabled us to reduce maintenance costs in Openserve. We saw assurance visits improving by 43% and redispatch rates reducing by 42%, resulting in maintenance cost reduction of R329 million for the year. The benefits on opex were partially offset by the increase in other operating expenses, service fees and lease expenses, primarily due to the change in revenue mix in BCX and the 746 new sites built in support of the mobile growth.
Working capital improvement
FCF improved threefold due to working capital improvement
| FCF movement | FY2020 Rm |
FY2019 Rm |
Change % |
|||
| Cash generated from operations | 12 765 | 8 903 | 43.3 | |||
|---|---|---|---|---|---|---|
| Repayment of lease liability | (1 148) | − | (100.0) | |||
| Interest received | 212 | 441 | (51.9) | |||
| Finance charges paid | (1 006) | (847) | (18.8) | |||
| Taxation paid | (1 320) | (945) | (39.7) | |||
| Operating free cash flow (FCF) before capital expenditure | 9 494 | 7 552 | 25.7 | |||
| Cash paid for capital expenditure | (7 712) | (7 584) | (1.7) | |||
| FCF | 1 782 | (32) | 5 668.8 | |||
| VSP, VERP and section 189 costs paid | 175 | 566 | (69.1) | |||
| Adjusted FCF | 1 957 | 534 | 266.5 |
FCF has improved to R1.8 billion, underpinned by the significant improvement in cash generated from operations primarily due to the improvement in working capital.
As part of our cash release initiatives, we achieved strong improvement in working capital of R2.7 billion overall largely due
to aggressive cash collections from customers of R667 million, and trade payables improvement of R2.0 billion. We made
some structural changes to improve working capital inefficiencies by negotiating better payment terms with suppliers in
line with peers and industry practice where the average days payable outstanding is approximately 86 days. Suppliers
seeking early payment were onboarded to the supply chain finance programme platform, which resulted in a win-win for
both Telkom and suppliers. We will continue with these efforts as we weather
COVID-19 in FY2021.
Strengthened balance sheet
As a result of our strong FCF, we were able to improve our balance sheet. Following increased borrowings in the first half of the year of R1.8 billion, we were able to repay maturing debt of R1.2 billion in the second half of the year. As a result, our gearing improved since the first half of the year, with net debt to EBITDA excluding IFRS 16 reducing to 0.7x from 1.2x and from 0.8x in FY2019. Net debt to EBITDA ratio was also positively impacted by the liquidation of the short-term investment of R1.5 billion to fund phase one of the restructuring programme.
Payments amounting to R1.2 billion relating to voluntary separation and voluntary early retirement packages were made in April 2020.
Group CFO key focus areas
We are confident that in spite of the challenges posed by COVID-19, we will weather the storm. Due to the expected impact of COVID-19, with the economy expected to decline further, and with only three months into FY2021, it is uncertain what the extent of the impact of COVID-19 will be on our business. However, we are taking all steps to make sure that we remain financially resilient under these circumstances. We will continue to focus on the following:
- Sustainable cost management
- Cash preservation
- Mitigating refinancing risk
- Disciplined capital allocation
Sustainable cost management
We will focus on maintaining a tight control on cost escalation and we will continue with our initiatives to reduce fixed costs. We expect to realise a benefit of R1 billion from phase one of the restructuring as part of reducing the fixed cost associated with the declining fixed-voice business. We will commence with phase two of the restructuring in the second half of the year. Our initiatives to reduce direct expenses in mobile have started bearing fruit and these will continue in the new financial year, optimising the network and continuing with the rollout of more deep passive sharing sites. We are also reviewing contracts with third parties and suppliers to renegotiate better rates as well as other various initiatives on operating expenditure. We are targeting an estimate of between R1 billion to R2 billion cost savings for FY2021 through these initiatives.
Cash preservation
In these uncertain times cash preservation is key. Our relentless focus on cash preservation delivered great results in the second half of the year through cash release initiatives, and we will continue in FY2021.
We will continue with our cash release initiatives to generate a positive FCF position. We are targeting between R700 million to R1 billion of cash release initiatives and we want to maintain a cash buffer of more than R1.5 billion as a minimum. The targeted positive FCF position excludes the one-off items, namely restructuring payments, spectrum acquisition costs, and the R861 million payment to the South African Revenue Services (SARS) for the FY2012 tax dispute.
Mitigating refinancing risk
Given the long-term nature of our capex programme, we will continue to extend the maturity of our debt in line with the capex profile to avoid near-term refinancing risks. In FY2020 the debt book comprised 84% long-term debt compared to 47% in FY2019.
Annual redemptions remain at or below R2 billion per annum to manage the refinancing profile, and thus reduce refinancing risks. Given current market conditions we would like to maintain annual redemptions to below R2 billion per annum.
As we did with the TL20 redemptions, we will proactively manage our redemptions by buying back maturing debt or prefunding of such redemptions, subject to our liquidity positions and the overall market conditions.
We also increased the floating rate debt in line with the current interest rate cycle. The composition of our debt portfolio has shifted from 69% fixed in FY2019 to 48% and we continue to review the mix as the opportunity presents itself.
We have adequate debt headroom to be able to raise any additional funding that may be required in a volatile environment. Assuming a net debt to EBITDA of 2x, we have a net debt headroom of R7.2 billion while maintaining a 2x ratio. Rating agencies' guidelines are between 2x and 2.5x. We have adequate committed facilities available with banks amounting R5.7 billion to assist us to protect liquidity. The DMTN programme of R15 billion has R6.2 billion available. The funding under the DMTN is long term in nature, in line with our capex profile.
Disciplined capital allocation
We will continue with our renewed focus and disciplined approach to capital allocation. In allocating funds towards investments for growth, we will continue to focus on key growth areas that are in line with our investment strategy. However, given the current volatile environment that we are operating in, we will be flexible with regards to our investments, in order to protect the liquidity of the group. Should revenues decline we will equally reduce the capex investments in order to protect our liquidity position.
Outlook
Dividend suspended
The board declared a final dividend of 50.08410 cents per share in line with the current dividend policy, taking the annual dividend to 121.61046 cents per share for FY2020. Maintaining a strong balance sheet and protecting our liquidity position are of utmost importance, especially in the current depressed economic environment. We indicated in the first half of the year that we will review our dividend policy. In arriving at the decision to suspend the dividend, we considered the following factors:
- The imminent spectrum auction will require substantial capital and it is of strategic importance for Telkom to participate to ensure the sustainability of the mobile business
- We want to complete our investment programme in key areas for future growth
- We made payments relating to phase one of the restructuring programme in April 2020, the beginning of the new financial year
- We will be funding phase two of the restructuring programme, which we expect to implement in the second half of the year
- We have a commitment to pay SARS the remaining balance of the outstanding tax liability relating to the FY2012 tax dispute
- Protecting our liquidity during these uncertain times is critical to our business
Given all the above factors that are expected to impact Telkom, the board found it prudent to suspend the dividend policy for three years with effect from FY2021. Over this period, the capital will be redirected to the acquisition of spectrum and to complete the key capex programme to ensure the sustainability of our business. During the suspension of the dividend policy, the board will consider shareholder rewards in the event of excess cash from potential value unlock.
Medium-term guidance suspended
Telkom issued a medium-term guidance commencing in FY2019, with FY2018 being a base year of the medium-term guidance. FY2020 was our second year of the three-year guidance. Telkom has performed in line with its medium-term guidance except for the EBITDA guidance where we experienced challenges due to the deterioration in high-margin fixed-voice revenues due to the technology shift from legacy to next-generation in line with global trends. The lockdown response to the COVID-19 pandemic is expected to impact the South African economy significantly, but quantifying the likely magnitude of this unprecedented crisis is challenging. Different sectors within the economy are differently suited to continue operating during the five lockdown phases, and an unknown number of firms in a variety of sectors are expected to close as demand disappears. Against the backdrop of both exceptional economic weakness and heightened uncertainty, it is difficult to maintain the medium-term targets. The board found it prudent to withdraw the medium-term guidance until such time that it is able to quantify the impact of COVID-19 on its businesses.
During this time of uncertainty, management will continue to focus on the sustainable cost management programme and cash preservation initiatives to protect the profitability and liquidity of the business.
Tsholofelo Molefe
Group Chief Financial Officer
| FY2019 – FY2021 Medium-term guidance |
FY2020 Actual |
FY2019 – FY2020 Actual (CAGR two years) |
|||||
| Operating revenue | Mid-single digit | 3.0% | 4.2% | ||||
|---|---|---|---|---|---|---|---|
| EBITDA | Mid-single digit | (8.7%) | (0.4%) | ||||
| Capex to revenue | 16% – 20% | 18.0% | 18.2% | ||||
| Net debt to EBITDA (times) | ≤1.5x (post IFRS 16) | 1.3x (post IFRS 16) 0.7x (pre IFRS 16) |
1.3x |