
Leadership reflections on FY2026
2
FY2026 was characterised by disciplined and consistent execution of our data-led strategy. This enabled the Group to deliver quality earnings, margin expansion and resilient free cash flow (FCF) despite ongoing macro-economic and industry headwinds. The strong financial results translated into improved shareholder returns and demonstrated the resilience of our business model. Focused execution, operational efficiencies and ongoing strategic transformation enabled Telkom to exceed market expectations in a highly competitive environment. Our performance reflects that the consistent and disciplined strategy execution is gaining traction and has returned to strong progress all across key financial metrics.

The Group continued to benefit from deliberate migration towards data-led revenue streams, with strong momentum in mobile and fibrerelated services underscoring the success of our ongoing investment in infrastructure.
Disciplined cost management,
operational efficiencies and structural
improvements embedded in the cost
base contributed to improved
profitability, margin expansion and
a stronger cost-to-income profile.
We maintained a robust balance sheet,
underpinned by prudent capital
management, strong liquidity levels
and a conservative leverage position.
This gives us the flexibility to navigate
market uncertainties and invest in future
growth opportunities.
Capital allocation remained focused
on investments that enhance long-term
returns and support strategic growth
objectives.
Our strong cash generation enabled
continued reinvestment in the business
while enhancing shareholder returns.
Looking ahead, we remain committed to disciplined execution, prudent capital allocation and sustainable longterm value creation. We will continue to strengthen the Group’s competitive positioning and drive profitable growth.
Pro forma financial information
In FY2025, the Group recognised restructuring costs of R160 million. These costs did not recur this year.
In FY2025, the Group recognised a once-off cost of R618 million related to the loss from the settlement of the TRF liability. This cost did not recur this year.
| Continuing operations | Reported March 2026 Rm |
Pro forma2 March 2025 Rm |
Variance % |
| Group revenue | 44 477 | 43 880 | 1.4 |
|---|---|---|---|
| Group EBITDA | 12 480 | 11 792 | 5.8 |
| Group EBITDA margin (%) | 28.1 | 26.9 | 1.2 |
| Cost-to-income (%) | 73.0 | 75.1 | 2.1 |
| Group capex | 6 434 | 5 827 | 10.4 |
| FCF1 | 3 068 | 2 778 | 10.4 |
| Basic earnings per share (BEPS) (cents) | 719.5 | 681.7 | 5.5 |
| Headline earnings per share (HEPS) (cents) | 708.5 | 583.2 | 21.5 |
| Net debt to EBITDA (times) | 0.5 | 0.6 | (0.1) |
| 1 | This is a non-IFRS financial measure. |
| 2 | Refer to the Annual Results Booklet for the prior year reconciliation of the reported figures to the pro forma adjusted figures. |
Group revenue grew by 1.4% to R44 477 million, supported by the Group's data-led strategy. While growth remained below the medium-term mid-single-digit ambition due to macro-economic headwinds, constrained consumer spending and intensified competition, underlying operational momentum continued across the core platforms.
Growth was driven by a 9.1% increase in data-led revenue streams. Mobile data revenue rose by 10.5%, supported by strong subscriber growth.
Fibre-related data revenue grew by 6.3%, underpinned by ongoing fibre adoption and increased homes connected.
As expected, legacy services continued to decline. Fixed-voice and subscription revenue fell by 21.8%, customer premises equipment revenue declined by 23.0%, and non-fibre data revenue decreased by 33.4%, reflecting the structural migration away from legacy technologies.
The Group's continued investment in network modernisation and digital infrastructure remains central to long-term growth and competitiveness.
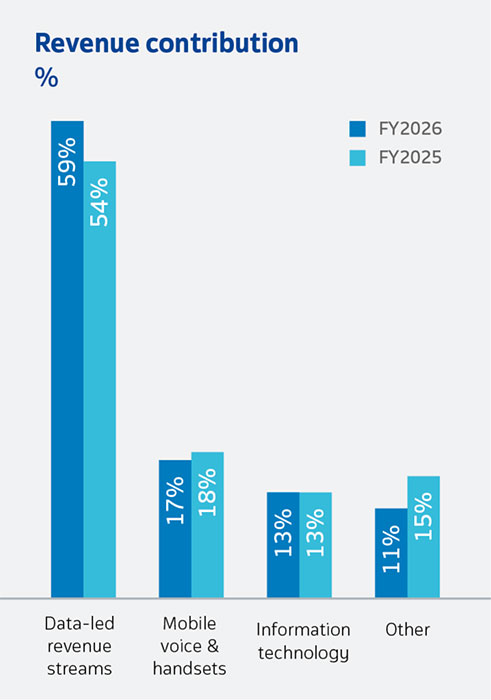
The revenue mix continued to improve. Mobile and fibre-related data revenue contributed 58.5% of Group revenue (FY2025: 54.3%), with total data revenue accounting for 59.8%.
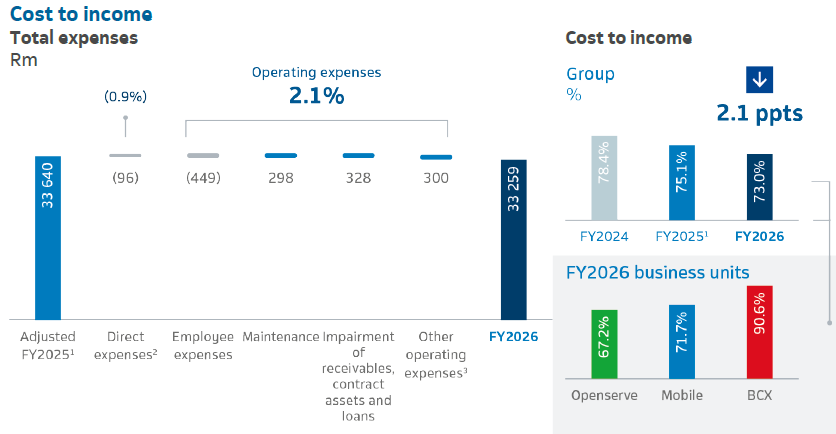
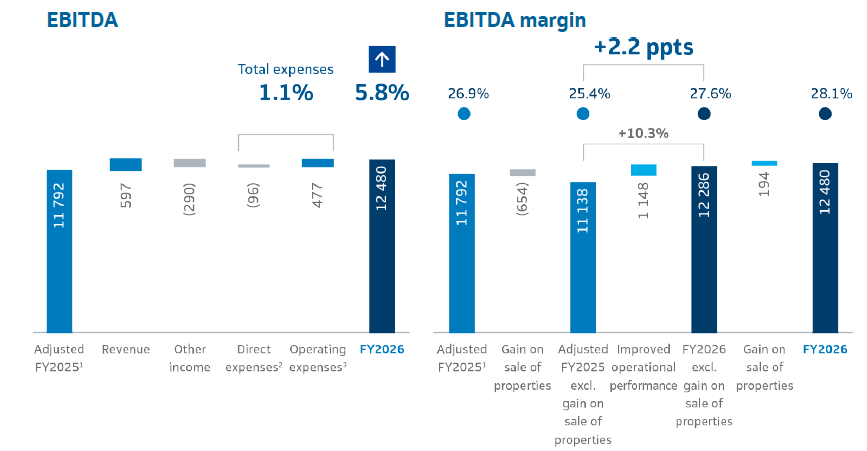
The Group delivered strong profitability growth in FY2026. EBITDA increased by 5.8% to R12 480 million, continuing to outperform revenue growth and demonstrating the benefits of disciplined execution, structural cost transformation and operational efficiencies across the business. As a result, the Group EBITDA margin expanded by 1.2 ppts to 28.1%, while the cost-to-income ratio improved by 2.1 ppts to 73.0%. This reflects meaningful progress in enhancing operating leverage and improving the quality of earnings.
Total expenses decreased by 1.1%, driven by structural cost improvements, lower impairments and operational efficiencies across business units. Operating expenses declined by 2.1% year on year.
Key efficiency initiatives included network simplification, energy transformation, maintenance optimisation and roaming cost management. These were complemented by strengthened credit management practices that improved collections performance and reduced credit risk exposure.
These gains were partially offset by higher people-related and commercial costs. Employee expenses rose by 5.6%, reflecting a 5.8% average salary increase and performance-linked incentives. Sales commissions and logistics costs increased by 11.5%, consistent with strong mobile subscriber growth and sustained commercial momentum.
| 1 | Excludes the impact of the TRF derecognition loss of R618 million and restructuring cost of R160 million in the prior year. |
| 2 | Includes the cost of handsets, equipment, software and directories, sales commissions and incentives, and payments to other operators. |
| 3 | Includes insurance service expense, other expenses, marketing, service fees and lease-related expenses. |
| 1 | Excludes the impact of the TRF derecognition loss of R618 million and restructuring cost of R160 million in the prior year. |
| 2 | Includes the cost of handsets, equipment, software and directories, sales commissions and incentives, and payments to other operators. |
| 3 | Includes insurance service expense, other expenses, marketing, service fees and lease-related expenses. |
The Group delivered strong earnings growth in FY2026 through disciplined execution and resilient operations.
HEPS increased by 21.5% to 708.5 cents and BEPS rose by 5.5% to 719.5 cents, driven by a 5.9% increase in profit after tax and a 5.8%² increase in Group EBITDA. Earnings were further supported by higher investment income on increased average cash balances and a 28.3% decrease in finance charges, benefiting from a 14.7% reduction in net debt.
Depreciation, amortisation, impairment and write-off expenses increased by 9.9%. This is mainly due to lease remeasurements for leases closer to the end of their period, as well as the increase in the depreciation for Swiftnet leases, which were external for a full 12 months in the current year compared to two months in the prior year. Higher additions to property, plant and equipment further contributed to the increase.
The performance was partially impacted by negative fair value adjustments from the rand strengthening against the US dollar, consistent with the Group's hedging strategy.
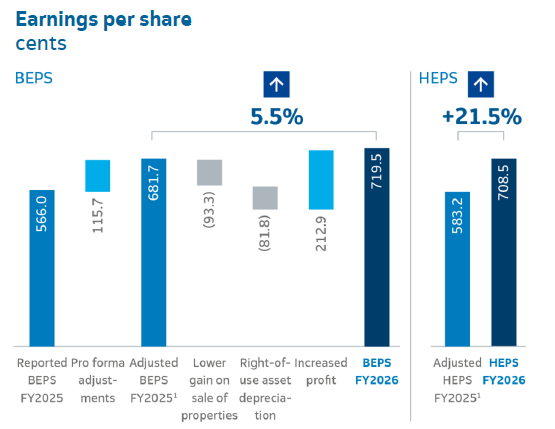
| 1 | Once-off costs relates to the TRF derecognition loss of R618 million and restructuring cost of R160 million. |
| Cents per share |
Reported FY2026 |
Reported FY2025 |
Adjusted FY2025 |
| BEPS | 719.5 | 566.0 | 681.7 |
|---|---|---|---|
| Property, plant and equipment and intangible assets | (11.0) | (98.5) | (98.5) |
| Net profit on disposal | (57.5) | (150.8) | (150.8) |
| Net write-offs and impairment | 46.5 | 52.3 | 52.3 |
| HEPS | 708.5 | 467.5 | 583.2 |
| WANOS1 | 492 587 195 | 490 660 883 |
| 1 | Weighted average number of shares. |
Capital expenditure increased by 10.4% to R6 434 million in FY2026, reflecting continued investment in strategic growth, network modernisation and digital infrastructure. Capex intensity remained within medium-term guidance at 14.5% (FY2025: 13.3%). Return on invested capital (ROIC) remained stable at 11.2%, applying the effective tax rate, demonstrating disciplined and efficient capital deployment.
Investment was focused on mobile and fibre infrastructure, network modernisation and digital enablement, supporting growing demand for connectivity and enhanced customer experiences, and strengthening network quality, coverage and competitive positioning.
IT and digital platform investment was further advanced through the ongoing business support system (BSS) transformation programme. This programme is aimed at implementing a cloud-native, AI-enabled technology platform to improve customer experience, enhance operational agility and accelerate product innovation.
Telkom strives to continually improve its ROIC through cost optimisation and revenue growth opportunities, while investing strategically in growth areas. ROIC is presented based on both the effective tax rate and the companies tax rate to enhance comparability. The prior year’s effective tax rate was distorted by the Swiftnet disposal.
| Extract of the
consolidated annual statement of profit or loss Continuing operations |
Reported March 2026 Rm |
Pro forma March 2025 Rm |
Pro forma adjustment1 Rm |
Reported March 2025 Rm |
| Operating profit | 5 933 | 5 835 | 778 | 5 057 |
|---|---|---|---|---|
| Taxation (effective tax rate) | (1 507) | (1 176) | (210) | (966) |
| Taxation (companies tax rate) | (1 602) | (1 575) | (210) | (1 365) |
| ROIC % based on effective tax rate | 11.2% | 12.0% | – | 10.6% |
| Operating profit after tax (effective tax rate) | 4 426 | 4 659 | 568 | 4 091 |
| Invested capital (closing balance) | 39 409 | 38 696 | – | 38 696 |
| ROIC % based on companies tax rate | 11.0% | 11.0% | – | 9.5% |
| Operating profit after tax (companies tax rate) | 4 331 | 4 260 | 568 | 3 692 |
| Invested capital (closing balance) | 39 409 | 38 696 | – | 38 696 |
| 1 | The prior year excludes the R618 million TRF derecognition loss and R160 million restructuring cost with the related tax impact. |
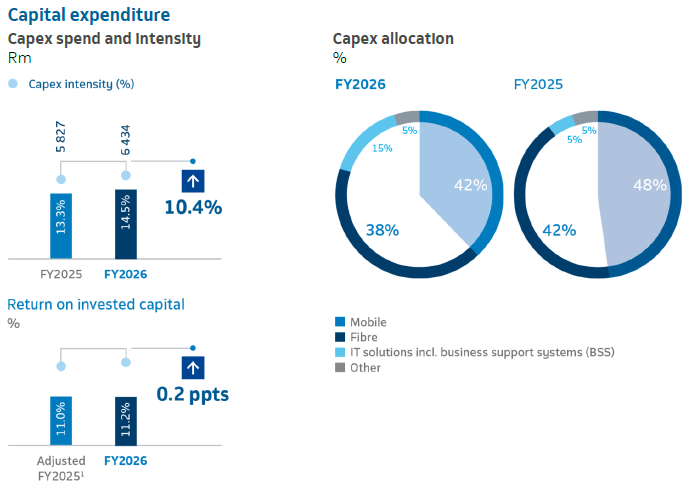
| 1 | ROIC is calculated on the SA companies taxation rate of 27.0%. With the effective tax rate applied, ROIC was 12.0% for FY2025. |
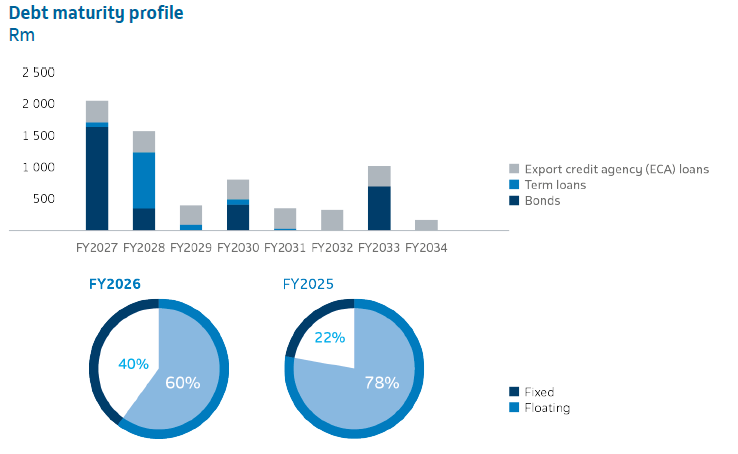
The Group maintained a strong financial position in FY2026. This was underpinned by disciplined capital management, sustained cash generation and prudent balance sheet optimisation, providing strategic flexibility to invest in growth and support shareholder returns.
Bank and cash balances decreased by 30.1% to R7 723 million, primarily reflecting the once-off R6.6 billion Swiftnet disposal proceeds received in the prior year. A portion of these proceeds was applied to repay R4 954 million of interest-bearing debt, while R1.3 billion was distributed to shareholders, partially offset by ongoing cash generation during the year.
Net debt decreased by 14.7% to R6 366 million (FY2025: R7 460 million), with the net debt to EBITDA ratio improving to 0.5x (FY2025: 0.6x). This placed the Group at the lower end of its medium-term leverage guidance range. Available liquidity exceeded interest-bearing debt levels, reinforcing balance sheet resilience and providing significant flexibility to pursue longterm value creation.
Free cash flow increased by 10.4% to R3 068 million (FY2025: R2 778 million), supported by disciplined cash management, structural cost improvements, lower lease liability repayments and reduced financing costs. This was achieved despite capex paid being materially higher in the year, as FY2025 included R398 million of Swiftnet-related capex paid prior to the disposal of the business.
Cash generated from operations decreased by 7.9% to R12 264 million. However, the prior year included several non-recurring cash flow items that impacted year-on-year comparability. These included cash receipts relating to the Google fibre transaction concluded in FY2025, and Swiftnet-related customer receipts and supplier payments recognised prior to disposal.
Excluding these prior-year, once-off and discontinued operation impacts, underlying operational cash generation remained resilient and broadly stable. This was supported by improved collections, disciplined working capital management and continued execution of structural cost optimisation initiatives across the Group.
Cash paid to suppliers and employees was impacted by working capital movements, including notably lower trade and other payables resulting from reduced operating expenditure and lower handset procurement activity during the year. Cash outflows were further affected by increased bonus incentives linked to business performance.
| March
2026 Rm |
March 2025 Rm |
Variance % |
|
| Cash receipts from customers | 45 389 | 44 484 | 2.0 |
|---|---|---|---|
| Cash paid to suppliers and employees | (33 125) | (31 163) | (6.3) |
| Cash paid to suppliers and employees | (33 125) | (31 493) | (5.2) |
| Proceeds from plan assets | – | 330 | 100.0 |
| Cash generated from operations | 12 264 | 13 321 | (7.9) |
| Repayment of principal lease liability | (1 910) | (2 496) | 23.5 |
| Interest received | 584 | 537 | 8.8 |
| Dividend received from the cell captive | 240 | – | 100.0 |
| Finance charges paid | (1 518) | (2 023) | 25.0 |
| Taxation paid | (297) | (396) | 25.0 |
| Cash generated from operations before dividend paid after lease payment | 9 363 | 8 943 | 4.7 |
| Cash paid for capex | (6 295) | (6 165) | (2.1) |
| Free cash flow1 | 3 068 | 2 778 | 10.4 |
| 1 | This is a non-IFRS financial measure. |
FY2025 comparability was also impacted by bulk handset acquisitions that remained outstanding at year-end, which did not recur in FY2026.
Lower principal lease repayments during the year were mainly due to the once-off settlement of the Google fibre pair lease in FY2025. This benefit was partially offset by the transition from internal to external lease payments following the disposal of Swiftnet. In addition, higher interest received, supported by improved average cash balances, together with lower finance charges and reduced taxation paid, contributed positively to overall cash generation during the year.
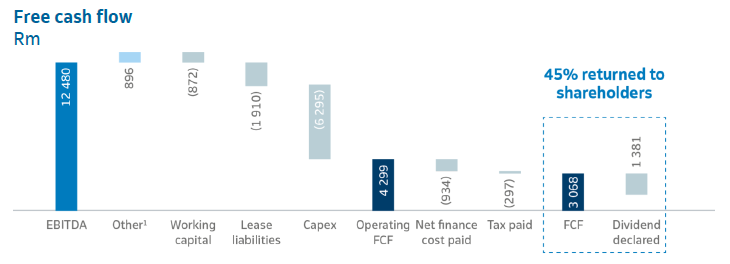
| 1 | Includes dividend received from the cell captive and non-cash items relating to the impairment of receivables and contract assets, provisions and deferred revenue as well as removing the gain on sale of assets. |
Overall, the Group maintained resilient free cash flow generation, underpinned by disciplined capital allocation, structural cost efficiencies and a continued focus on cash conversion. This strong cash generation capability supports ongoing reinvestment into strategic growth initiatives, balance sheet resilience and sustainable shareholder returns.
The Board declared an ordinary dividend of 270 cents per ordinary share (cps) (FY2025: 163 cps) from strong operational performance. This represents 45% of free cash flow generated. The declaration underscores our dedication to returning capital to shareholders while maintaining a balanced approach to reinvestment and financial flexibility.
Our data-led strategy and OneTelkom approach remain our core growth drivers as we enter the next phase of value creation, which focuses on efficiency gains, disciplined capex allocation and improved returns.
Global geopolitical tensions have heightened macro-economic volatility, driving higher oil prices, currency fluctuations and inflation that may pressure consumer spending and increase our diesel costs. We are actively monitoring developments and implementing mitigating measures.
In this environment, we will balance growth investment with cost discipline. Capex intensity will remain within 12% – 15%, primarily funding mobile and fibre, while cost efficiencies protect margins – collectively supporting free cash flow generation and a prudent leverage position.
At business unit level, Consumer will drive service revenue and fibre growth through enhanced customer experience, dynamic value propositions and the regional market share strategy. Mobile service revenue is expected to grow at a mid-single-digit rate. Openserve will pursue revenue growth across broadband, enterprise and carrier segments, with network simplification and energy transformation supporting EBITDA margin expansion, alongside continued FTTH rollout. BCX is repositioning connectivity as the foundation for scalable digital services – including cloud, data platforms and intelligent applications – while rationalising its IT product portfolio to improve profitability.
Entering the second year of our mediumterm guidance in FY2027, we remain confident that the guidance provided on 10 June 2025 captures our commitment to disciplined execution in an evolving market.

The Board revised the dividend policy in FY2026, increasing the payout range to 40% – 60% of free cash flow (previously 30% – 40%).
The revised policy reflects the Group's commitment to enhancing shareholder returns, underpinned by resilient free cash flow generation and a strong financial position, while continuing to support investment in strategic growth, network modernisation and operational resilience.
The Group is well positioned to build on the FY2026 momentum, supported by a strong financial foundation and disciplined execution, to drive sustainable long-term value creation.
Nonkululeko Dlamini
Group Chief Financial Officer